Search Options Trading Mastery:
- Home
- Stock Chart Analysis
Stock Chart Analysis
Welcome to our Stock Chart Analysis Introductory & Contents Page
In order to be a good options trader, stock chart analysis skills should form a major component of your decision making process, particularly if your strategy involves anticipating short term market moves. Reading and interpreting price action charts is often referred to as "Technical Analysis" (as opposed to "Fundamental Analysis") and the purpose of this section of our site will be to explore the most popular methods used to do this.
Being good at stock chart analysis is more an art than a science. We can provide the "science" behind technical analysis of stock charts, but to actually turn it into an "art" requires practice. You could think of it as something like learning to play the piano. Your teacher can show you how it's done (the science), but if you wish to become a good pianist, you have to practice, practice, practice.
After a while, it becomes intuitive - you can look at all these notes on a page and translate them into fingers running over a keyboard with skill and ease. Now you have turned the science into an art.
Technical analysis of chart patterns is no different. Your ultimate aim should be, to look at a price chart, draw your trend lines, add your indicators and when it's all done, be able to 'feel' what is about to happen.
To make stock chart analysis easier for you, we will approach it at two levels - "Level One" and "Level Two" analysis.
Level One Analysis starts with the basics - how to draw trendlines, support and resistance lines and understanding the role of moving averages. Then we identify chart patterns such as channels, double tops, double bottoms, head-and-shoulder patterns, pennants, flags, triangle formations and the like. We will also look at candlestick charts, western bar charts and line charts - what they are and how to use them.
Level Two Analysis brings us to the use of indicators. These build upon what we have already observed in our "Level One" work and serve as confirmation signals. Technical indicators give us deeper insight into the behaviour of a stock and do so from two perspectives:
Momentum Indicators - These tell us when a price trend is likely to be strong or warn us when it may be weakening and due for a possible pullback or even reversal.
Volatility Indicators - these help identify price breakouts following a period of consolidation. Price fluctuation has been quiet and suddenly it starts to move, or become volatile. Price breakouts are one of the most reliable signals for short term option trading opportunities.
Other aspects of stock chart analysis we will look at include fibonacci retracements, the popular ABC points used in swing trading together with the use of Elliot Wave Theory and also the work of W.D. Gann. These are used to explain patterns of human behaviour, as buyers and sellers motivated by greed and fear, battle one another for supremacy.
Since market price movements tend to behave in a typical way, understanding these points of resistance and/or continuation help to increase the probability that our anticipation of future price direction will be correct.
So let's dig deeper into this fascinating subject - but remembering that when it's all said and done, a stock, commodity or forex price can only do one of three things - (1) Move up; (2) Move down, or (3) Do nothing. Before you even start, you have a one-in-three chance of being right. Technical analysis of chart patterns is designed to help you choose which one.
Stock Chart Analysis - Table of Contents
1. Technical Analysis of Stock Charts
Technical analysis of stock charts is both a science and an art. The science is in understanding the theory; the art is in developing the intuition that sees these things instinctively.
2. Stock Market Trend Analysis - Stock market trend analysis is not a difficult skill to learn. The real challenge lies in being able to determine whether the trend will continue or if it is about to reverse.
PRICE CHART PATTERNS
1. Channel Pattern Trading
Channel pattern trading is one of the easiest technical analysis techniques to implement - and the good news is, that most financial instruments will channel at least 20 percent of the time.
2. Triangle patterns - Ascending, Descending, Symmetric
Stock chart triangle patterns are classic setups for great option
trades because they identify the consolidating price action that usually
precedes a breakout.
3. Head and Shoulders Patterns - The head and shoulders pattern is a classic and mostly reliable chart reversal pattern that is typically seen at the top of an uptrend. Once validated, it also allows you to predict a future price target.
4. Double Tops and Bottoms - Double tops and bottoms are one of the most reliable chart patterns to trade. But when do they work and when don't they?
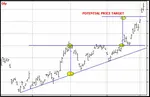
5. Flag Chart Patterns
- The big advantage with the flag chart pattern, is that it allows you
to anticipate price targets for the underlying financial instrument
that you're trading options on.
6. Wedge Chart Patterns
- Identifying and trading the wedge chart pattern helps spot trend reversals, price targets and new support or resistance areas.
12. Island Cluster Reversals - How you can trade island cluster reversals. Let's start by identifying what this chart pattern is and how we can use it.
PRICE ACTION PATTERNS
1. Inside Days
Inside days are a powerful candlestick pattern suitable for 'automated' day trading, that has even been promoted by some as 'the one trading secret that can make you rich'.
2. Candlestick Patterns and What They Mean
Here we explain the six most popular bullish and bearish candlestick chart patterns, together with another four continuation patterns. Understanding these can make a big difference to traders.
Momentum Indicators and Oscillators
1. The MACD Indicator
2. RSI Indicator
The RSI indicator provides preemptive signals of a potential change
in trend. This is one tool you should always pay attention to if you
trade options with the trend.
3. Stochastic Indicator
The Stochastic indicator, often called CStats, is a chart study that
is all too misunderstood in the trading community. But used correctly,
it can warn of price action reversals.
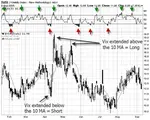
4. Exponential Moving Averages
The Exponential Moving Average can be a powerful ally when timing entry and exit points on daily charts. The EMA3 and EMA9 crossovers provide useful bullish or bearish signals.
Volatility Indicators
5. Bollinger Band Trading
Bollinger Band Trading - your number one support tool for options. They are helpful for both entry and exit signals, providing a great deal of information about volatility.
Other Stock Chart Analysis Tools
1. Fibonacci Percentages
I have found Fibonacci percentages to be one of the most useful and reliable tools when defining retracement levels and setting potential profit targets, particularly with forex and options trading.
2. Elliott Wave Theory
Elliott wave theory is one of the most exciting of all technical analysis tools. Once you see how this works, it will change the way you trade forever.
3. ABC Chart Patterns and W.D. Gann
4. Ino.com's Daily Market Analysis
The Best Part About INO's Daily Market Analysis is, that it's free. If you're an option trader, or any kind of trader for that matter, you should seriously consider this one.
5. Become a Master Chartist with IM Academy
While not strictly about stock charts or options trading, the IM Academy has some of the top educators in price chart analysis on the planet. You will learn a lot here and improve your technical analysis skills.
***************** *****************
Return to Options Trading Homepage

Popular Articles
-
Near Riskless Trading Strategies
Near Riskless Trading strategies using options, allows you to use advanced arbitrage techniques for highly profitable, almost risk free results. -
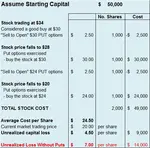
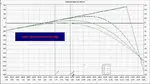
Wealth Building Options Trading
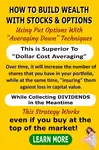 Wealth building options trading - how to profit from share investments even if you buy at the top of the market.
 -
The Three Legged Box Spread - A Great Lifestyle Trade
 Whether you only have a few thousand or a large sum to invest, the Three Legged Box Spread is one of the best option trading strategies available for retail investors today.
 -
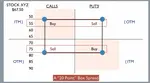
XTR ProTrader Signals
-
The Double Calendar Spread
 The double calendar spread is a very safe option strategy which profits consistently - provided you know exactly what to do when price action threatens it.
 -
ETF Options - Why You Should Trade Them
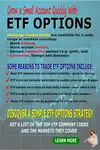 ETF Options when combined with the right options strategy, can be one of the best and safest ways to profit consistently from the financial markets.
 -
The Covered Put Option Strategy
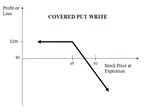 The covered put option strategy explained, with payoff diagram and examples. These are most suited to a bearish to neutral market.
 -
How to Use the VIX
 Knowing how to use the VIX should be essential for all traders whose portfolio of positions may be affected by general market sentiment.
 -
Using Options to Buy Stocks at Discount Prices
 Did you know that you could be using options to buy stocks so much cheaper than if you just went to your broker and simply bought them at market price?
 -
How Option Price Movements Effect Gains and Losses
Knowing about and understanding how options work is a potent arrow in a trader’s quiver. One of the things that people new to options must understand -
When can you trade Forex Options?
The forex market is the largest financial market in the world which works 24 hours, 5 days per week, if you consider the whole world as a single entity. -
Iron Condor Option Strategy
 In this iron condor option strategy we show you the best way to leg into positions safely and also to adjust your positions when they are threatened.
 -
What is a Straddle Option? A Great Delta Neutral Strategy!
 So what is a straddle option and why is it such a great options trading strategy? You don't have to pick market direction and can still profit very well.
 -
The Long Iron Butterfly - Credit Spreads on Steroids
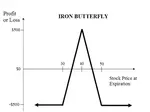 The long iron butterfly is a range trading strategy and a variation of the Iron Condor. Both these strategies use two credit spreads using both calls and puts
 -
The Distinct Advantage Credit Spreads Are Known For
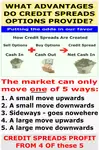 So what is the advantage credit spreads give us? This example will demonstrate how we can turn a losing trade into a profitable one.
 -
Box spreads Illustrated and Explained
Box spreads are an option trading strategy that involves purchasing a bull-call spread with a corresponding bear-put spread. The two vertical spreads have the same expiration dates and strike prices. -
Exotic Options Explained With Examples
Exotic options are typically more complex than regular options. They are most popularly traded on currency pairs but can also be traded on stock options, stock indexes, warrants and commodity options -
Hoadley Options Tools Review
 Hoadley Options Trading and Investment Tools is an Excel based tool that makes options risk analysis easy.
 -
Free Option Trading Software
So we've done some research for you and below, you'll find a summary of some of the best free option trading software available. -
Invest in Soxange and Multiply Earnings through Copying the Top Traders in this Social Network
Within the context of the online trading world, SoXange is one of the few trading platforms that draw all kinds of traders in droves to that online trading

Amazon Affiliate
Copyright © 2002- Options Trading Mastery. ALL RIGHTS RESERVED.
Other Recommended sites:
NaturalRelieved | European Travel Escape | Relationships Guide
New! Comments
Have your say about what you just read! Leave me a comment in the box below.