Search Options Trading Mastery:
- Home
- Stock Chart Analysis
- Exponential Moving Average
The Exponential Moving Average
Entry and Exit Signals Using the Exponential Moving Average
The Exponential Moving Average (EMA) is an oscillator that is calculated from the closing price of an asset for a given time period. The number of closing prices that are required will depend on your own choice and will affect its sensitivity to the price action.
The good thing about the EMA is that it pays more attention to the most recent price by using the last close in the calculation and assigning it more value. Consequently, the EMA will react to the newest price more effectively and will not be affected by the oldest price dropping off the calculation, as in the case of the standard Moving Average.
For those who are mathematically inclined, you can calculate the exponential moving average using the following formula:
EMA = EMAp + {K x (Price - EMAp)}
Where:
EMA = Exponential Moving Average
EMAp = the previous period exponential moving average
K = smoothing constant (see below)
Price = current price
The smoothing constant is derived from the time period selected by the user according to the following formula:
K = 2(n+1) where n is the time period chosen by the user.
Take a look at the following table for results of a working example.

Using the above calculation the value in the above table, highlighted in yellow, would be calculated as follows:
K = 2(9+1) making K=0.20
EMA = 63.563 + (0.20(61.33-63.563)) making EMA = 63.117
Mind numbing stuff isn't it!
Fortunately, these days, most charting software does it all for you and presents it in graphical form.
The Exponential Moving Average - What Does it Tell Us?
The way to use the EMA is twofold. If we are trading options on stocks short term, we can use the 9 day EMA to decide whether a stock is bullish or bearish.
We can deduce this by looking where the EMA is in relation to the stock's price action. Simply put, if the price action is above the EMA9 then the stock is considered to be bullish in the short term. If it is below the EMA9 we would consider it bearish.
All things considered, once the stock is above the EMA9 we can anticipate a high probability that it will remain bullish in the short term. Consequently, the EMA acts as a support and resistance line.
So does this give us a trading signal, or is there more?
If we include both an EMA3 and an EMA9 on our daily stock charts, the combination gives us a great oscillator. The EMA9 line will be smoother than the EMA3 due to the longer period it covers, but the EMA3 acts as a trigger line.
- Once the EMA3 crosses above the EMA9 the stock has a bullish bias.
- WHEN THE EMA3 crosses below the EMA9 the stock has a bearish bias.
Using the Exponential Moving Average to Enter a Trade
We can use the EMA's in conjunction with our trend lines as a confirmation tool when assessing the timing of our entry into bullish or bearish options strategies.
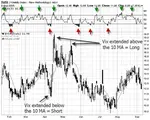
The image below demonstrates a price breakout to the downside, which is confirmed by the EMA3 crossing below the EMA9.


Using the Exponential Moving Average While IN a Trade
We can also use the EMA's to influence the timing of our exit from a trade. The following image is a continuation from the one above.
As long as the EMA3 remains below the EMA9 we are not given an exit signal so if we had purchased put options at the point marked in yellow, we would be doing very well at the latest price point.

It is not recommended that the EMA crossover should be used on its own as an exit signal, as the underlying asset can rebound without the EMA3 and EMA9 crossing over. But if you do wish to use it as a technical exit, try it with a percent trailing exit system.
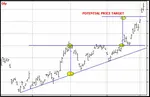
Important - trading the EMA crossovers should only be done in strong trending markets. As can be seen below, strongly trending markets can continue for quite some time.

Notice the crossover at bottom left of the above chart. The bullish trend then continues for many days without an exit signal being given.

**************** ****************
Return to Stock Chart Analysis Contents Page
Go to Option Trading Homepage

Add a Comment
We and other readers of this information site value your input.
You can also (optionally) include any graphics such as charts, if you wish.
Popular Articles
-
Near Riskless Trading Strategies
Near Riskless Trading strategies using options, allows you to use advanced arbitrage techniques for highly profitable, almost risk free results. -
Wealth Building Options Trading
 Wealth building options trading - how to profit from share investments even if you buy at the top of the market.
 -
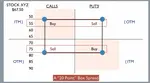
The Three Legged Box Spread - A Great Lifestyle Trade
 Whether you only have a few thousand or a large sum to invest, the Three Legged Box Spread is one of the best option trading strategies available today.
 -
XTR ProTrader Signals
-
The Double Calendar Spread
 The double calendar spread is a very safe option strategy which profits consistently - provided you know exactly what to do when price action threatens it.
 -
ETF Options - Why You Should Trade Them
 ETF Options when combined with the right options strategy, can be one of the best and safest ways to profit consistently from the financial markets.
 -
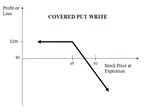
The Covered Put Option Strategy
 The covered put option strategy explained, with payoff diagram and examples. These are most suited to a bearish to neutral market.
 -
How to Use the VIX
 Knowing how to use the VIX should be essential for all traders whose portfolio of positions may be affected by general market sentiment.
 -
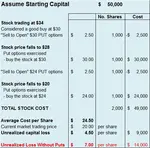
Using Options to Buy Stocks at Discount Prices
 Did you know that you could be using options to buy stocks so much cheaper than if you just went to your broker and simply bought them at market price?
 -
How Option Price Movements Effect Gains and Losses
Knowing about and understanding how options work is a potent arrow in a trader’s quiver. One of the things that people new to options must understand -
When can you trade Forex Options?
The forex market is the largest financial market in the world which works 24 hours, 5 days per week, if you consider the whole world as a single entity. -
Iron Condor Option Strategy
 In this iron condor option strategy we show you the best way to leg into positions safely and also to adjust your positions when they are threatened.
 -
What is a Straddle Option? A Great Delta Neutral Strategy!
 So what is a straddle option and why is it such a great options trading strategy? You don't have to pick market direction and can still profit very well.
 -
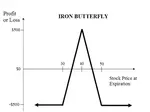
The Long Iron Butterfly - Credit Spreads on Steroids
The long iron butterfly is a range trading strategy and a variation of the Iron Condor. Both these strategies use two credit spreads using both calls and puts -
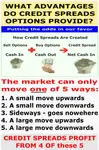
The Distinct Advantage Credit Spreads Are Known For
So what is the advantage credit spreads give us? This example will demonstrate how we can turn a losing trade into a profitable one. -
Box spreads Illustrated and Explained
Box spreads are an option trading strategy that involves purchasing a bull-call spread with a corresponding bear-put spread. The two vertical spreads have the same expiration dates and strike prices. -
Exotic Options Explained With Examples
Exotic options are typically more complex than regular options. They are most popularly traded on currency pairs but can also be traded on stock options, stock indexes, warrants and commodity options -
Hoadley Options Tools Review
 Hoadley Options Trading and Investment Tools is an Excel based tool that makes options risk analysis easy.
 -
Free Option Trading Software
So we've done some research for you and below, you'll find a summary of some of the best free option trading software available. -
Invest in Soxange and Multiply Earnings through Copying the Top Traders in this Social Network
Within the context of the online trading world, SoXange is one of the few trading platforms that draw all kinds of traders in droves to that online trading


Amazon Affiliate
Copyright © 2002- Options Trading Mastery. ALL RIGHTS RESERVED.
Other Recommended sites:
NaturalRelieved | European Travel Escape | Relationships Guide
New! Comments
Have your say about what you just read! Leave me a comment in the box below.