Search Options Trading Mastery:
- Home
- Stock Chart Analysis
- Bollinger Band Trading
Bollinger Band Trading
Bollinger Band Trading - Your Number One Support Tool for Options
Bollinger band trading is all about volatility. This indicator provides a great deal of information, including a graphical representation of how volatile the current price action of any given security is. Understanding how price volatility works and how you can take advantage of it can make a big difference to your profit levels.
For the purpose of this discussion, we will assume we are trading options on stocks, but you can use them just as effectively on forex pairs or commodity futures.
Bollinger bands form a kind of support and resistance on either side of the price bars or candles on a price chart. They are like an envelope around the price action, usually hovering around a moving average in the middle.
When the stock is experiencing a highly volatile trading period, the bands will automatically flare, or fan out, so that the stock has more room to move within them. When the price action consolidates into a low volatility range, the bands will constrict and move closer together.
Bollinger Band Trading - Over Bought and Over Sold
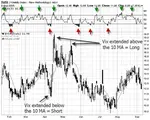
While it is normal for a stock's price action to remain with the upper and lower Bollinger Bands, it is also possible for it to breach these areas. When this occurs, we can consider it overbought for upper breaches and oversold when breaching the lower band.
As previously mentioned, Bollinger Bands are used in conjunction with a moving average. For short term traders, a 9 day Moving Average along with a 9 day Bollinger Band is quite effective. However, for longer term strategies you might want to consider 20, 50 and 80 day settings.
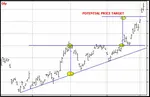
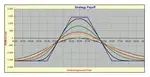
Here is a sample of what the 9 day bands and their moving average look like:

Using Bollinger Band Trading
You should consider this your number one support tool when option trading. It is helpful for both entry and exit signals.
If the price action on any given day closes outside the Bollinger Bands, it is usually a sign that a strong move is in progress which is likely to continue. However, should the same thing occur after the second day of a move, it then becomes a strong sign that the underlying security is moving into overbought or oversold territory and therefore may not be able to sustain it's current direction. This would be a good time to take some profits or exit the trade altogether.
Bollinger Band Trading and Historical Volatility
The easiest way I have found to gauge the price volatility of a stock is simply by looking at the past performance of the Bollinger Bands. When the Bands are close together and hugging the price bars, it means that volatility is low.
While the price volatility of the underlying is low, both call and put options will generally also be cheap. When they expand, at-the-money options tend to become more expensive.
Therefore a good general rule of thumb when trading simple long options positions or other derivatives for a profit, is to buy when the Bands are relatively close together and sell when they are wide.
Bollinger Band Trading and Implied Volatility
Implied Volatility is that "extra" factor included in the calculation of an options price, after all other elements of an options pricing model have been taken into account. It reflects the expected future price movement of the underlying and therefore, how cheap or expensive an option becomes.
A stock which has a fast moving share price will usually be in higher demand and therefore, the option contracts will attract a higher premium. This is one reason why the timing of simple long options positions can be critical.
The Bollinger Bands help us here. If you enter a long put or call options position as the bands are beginning to flare out after being close together, your options should be still relatively cheap. If the price action continues to widen the bands, the increased volatility will likewise increase the options price so that your profits will be magnified.
It is important to note that when the Bands are wide, the option prices will be high for those supporting the direction of the move, while those supporting the opposite direction will be cheaper. This can be handy knowledge for trading channels or backing patterns.
Bollinger Bands offer a visual indicator of volatility - this is why they're so reliable. The term you choose for your Bollingers will depend on whether your trading approach is long or short term. For short term options traders, I have found a 9 day term the most useful.
Bollinger Band Trading - Some Rules to Follow
1. The upper and lower bands act as dynamic support and resistance for the underlying asset.
2. If the price action of the stock moves outside the Bands on the first or second day of a breakout, it suggests that the move is likely to continue.
3. If the price action of the stock moves outside the Bands AFTER the first or second day of such a breakout, it is a good idea to exit a trade if you're already in one, because at this point a reversal is more likely.
4. Following a breakout, if the price bars/candles are sliding along either the upper or lower bands, it indicates that the stock price action is moving effortlessly in one direction and likely to continue that way.
5. The best time to take profits is when the Bands are wide and the price of the underlying has moved in your favour. Don't wait for signals that the move is stalling.
6. The moving average between the bands can act as a support and resistance line.
7. When the price of the stock, forex pair or other underlying asset is above the moving average (MAV), it is likely to stay there. So we watch for definite "breaks" above or below the MAV.
8. As price volatility rises the Bands will begin to widen. As it falls, they will squeeze in together. Options traders should employ buying strategies when the Bands are tight and selling strategies when they are wide. Quite often, your entry signals will be evident before price volatility rises.
9. After entering a long options position, maximum profits are achieved once the price bars or candles move outside the widened Bands. This is your ideal profit taking opportunity.
10. To help with the timing of your entry, use the Moving Average as a support and resistance line, as well as the upper and lower Bands as an indication of volatility levels and the strength of the move.
Finally . . .
Remember that this indicator is a guide only. It cannot predict future volatility of price action. It simply reflects the historical and current volatility of the stock at any given time. Do not place a trade based on this indicator alone. It should be used only in conjunction with your other entry signals. The function of Bollinger Band trading is to enhance your profits, not to determine them.
**************** ****************
Return to Stock Chart Analysis Contents Page
Go to Option Trading Homepage

Popular Articles
-
Near Riskless Trading Strategies
Near Riskless Trading strategies using options, allows you to use advanced arbitrage techniques for highly profitable, almost risk free results. -
Wealth Building Options Trading
 Wealth building options trading - how to profit from share investments even if you buy at the top of the market.
 -
The Three Legged Box Spread - A Great Lifestyle Trade
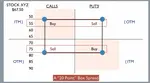 Whether you only have a few thousand or a large sum to invest, the Three Legged Box Spread is one of the best option trading strategies available for retail investors today.
 -
XTR ProTrader Signals
-
The Double Calendar Spread
 The double calendar spread is a very safe option strategy which profits consistently - provided you know exactly what to do when price action threatens it.
 -
ETF Options - Why You Should Trade Them
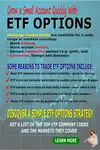 ETF Options when combined with the right options strategy, can be one of the best and safest ways to profit consistently from the financial markets.
 -
The Covered Put Option Strategy
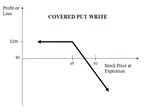 The covered put option strategy explained, with payoff diagram and examples. These are most suited to a bearish to neutral market.
 -
How to Use the VIX
 Knowing how to use the VIX should be essential for all traders whose portfolio of positions may be affected by general market sentiment.
 -
Using Options to Buy Stocks at Discount Prices
 Did you know that you could be using options to buy stocks so much cheaper than if you just went to your broker and simply bought them at market price?
 -
How Option Price Movements Effect Gains and Losses
Knowing about and understanding how options work is a potent arrow in a trader’s quiver. One of the things that people new to options must understand -
When can you trade Forex Options?
The forex market is the largest financial market in the world which works 24 hours, 5 days per week, if you consider the whole world as a single entity. -
Iron Condor Option Strategy
 In this iron condor option strategy we show you the best way to leg into positions safely and also to adjust your positions when they are threatened.
 -
What is a Straddle Option? A Great Delta Neutral Strategy!
 So what is a straddle option and why is it such a great options trading strategy? You don't have to pick market direction and can still profit very well.
 -
The Long Iron Butterfly - Credit Spreads on Steroids
 The long iron butterfly is a range trading strategy and a variation of the Iron Condor. Both these strategies use two credit spreads using both calls and puts
 -
The Distinct Advantage Credit Spreads Are Known For
 So what is the advantage credit spreads give us? This example will demonstrate how we can turn a losing trade into a profitable one.
 -
Box spreads Illustrated and Explained
Box spreads are an option trading strategy that involves purchasing a bull-call spread with a corresponding bear-put spread. The two vertical spreads have the same expiration dates and strike prices. -
Exotic Options Explained With Examples
Exotic options are typically more complex than regular options. They are most popularly traded on currency pairs but can also be traded on stock options, stock indexes, warrants and commodity options -
Hoadley Options Tools Review
 Hoadley Options Trading and Investment Tools is an Excel based tool that makes options risk analysis easy.
 -
Free Option Trading Software
So we've done some research for you and below, you'll find a summary of some of the best free option trading software available. -
Invest in Soxange and Multiply Earnings through Copying the Top Traders in this Social Network
Within the context of the online trading world, SoXange is one of the few trading platforms that draw all kinds of traders in droves to that online trading

Amazon Affiliate
Copyright © 2002- Options Trading Mastery. ALL RIGHTS RESERVED.
Other Recommended sites:
NaturalRelieved | European Travel Escape | Relationships Guide
New! Comments
Have your say about what you just read! Leave me a comment in the box below.