Search Options Trading Mastery:
- Home
- Stock Chart Analysis
- Channel Pattern Trading
Channel Pattern Trading
Channel Pattern Trading - The Easy Way to Make Money
Trading channel chart patterns would have to be one of the easiest technical analysis techniques to implement - and the good news is, that on average, most financial instruments will channel at least 20 percent of the time. In fact, rather than drawing trend lines on your chart, the first choice should always be to look for a channel and if that isn't there, then settle for a trendline.
Channel pattern trading can be a very powerful ally when using the leverage that comes with options. The nice thing is, that using options you can trade both ways - up or down. But there are a few things to be aware of. Taking heed to these will potentially save many losing trades.
Sideways channeling stocks can present themselves at any time, but more often than not, they precede a major shift in direction, such as a swing from a bull to a bear market, or vice versa.
This being the case, it is important to remember that at some point, every channel pattern will end and recognizing the signs in advance will prevent bad trading decisions. It also means that identifying a channel as early as possible allows you to take advantage of them before they end.
Channel patterns can take three forms:
(1) Sideways channels - defined by two horizontal lines.
(2) Up trending channels - also known as "Ascending Channels"
(3) Down tranding channels - also knowns as "Descending Channels"
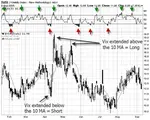
Below, you'll see a chart of BHP where we illustrate how all three channel patterns present themselves. If you look at the notes on the chart, you'll also observe some warning signals that the channel was about to end.

Channel Pattern Trading - Profiting With Options
We can see from the above chart that channel pattern trading is based on identifying two parallel lines. To the left of the chart we see a descending channel. This is followed by a sideways channel that precedes a price action reversal so that the stock now trends north into an ascending channel pattern.
As the ascending pattern begins to fail, the warning signal presents itself when the last high point fails to reach the top of the channel. It warns of weakness, which is confirmed when to the right of the chart, the price fails to bounce off the lower trendline and breaches it instead, plummeting down to around the same levels as the bottom of the previous sideways channel.
Notice also, the warning signal at the end of the sideways channel. The final price trough failed to reach the horizontal support line, warning of possible weakness. Sure enough, it thrust through the upper resistance level and continued north, then pulled back and forth a few times to form a flag pattern before moving north again.
Channel Pattern Trading - Waiting for Validation
One of the worst mistakes a trader can make, is entering a position which anticipates a bounce off a channel support or resistance line. You must always, ALWAYS wait for validation.
What do we mean by validation? If you look to the far right of the chart, an example of failed validation is given. Validation is a price move which breaches the short term trendline that you would draw within the channel.
It should preferably be accompanied by supporting volume and a nice bullish or bearish bar or candle. This validates the short term price reversal and provides an entry signal you can be confident about.
Trading Channel Patterns
You may have heard the expression "the trend is your friend". This applies just as much with channel pattern trading as it does with swing trading. In fact, trading ascending and descending channels are just another form of swing trading, only the price moves more defined.
When trading an ascending channel, it is always safest to only trade validated reversals from the troughs. Trading reversals from the peaks means going against the trend and carries more risk.
The reverse applies to descending channels. But all the while you must be on the lookout for potential reversals because you know that all channels end at some point.
Some aggressive traders may try to trade minor swings in the market, but this is not recommended for beginners. If you are new at this, only trade with the trend.
When drawing your upper and lower trendlines, you don't need to strictly adhere to the highest and lowest points. The most valid trendlines are those that have the most "touches" of peaks or troughs.
You'll notice for example, that in the new ascending channel to the right of our chart above, that we ignored the first high point because there were more "touches" in the price consolidation area just below it.
On the other hand, if you have to "force" your channel to appear by drawing strange lines, you are probably working too hard and looking for something that doesn't exist.
Options Trading Channel Patterns
Some very successful options traders I know of will only do channel pattern trading and nothing else because they consider them high probability trades.
You trade put options in a downward channel and call options in an upward price channel. When choosing your options strike prices, you should prefer in-the-money options with a high delta.
You should also know how to interpret the volume bars on your chart. The reasons for this are explained more fully in the popular Winning Trade System developed by veteran trader, David Vallieres.
His method is the most cost effective way to trade because it minimizes brokerage costs while providing a strong buffer should the price action go against you.
**************** ****************
Return to Stock Chart Analysis Contents Page
Go to Option Trading Homepage

Add a Comment
We and other readers of this information site value your input.
You can also (optionally) include any graphics such as charts, if you wish.
Popular Articles
-
Near Riskless Trading Strategies
Near Riskless Trading strategies using options, allows you to use advanced arbitrage techniques for highly profitable, almost risk free results. -
Wealth Building Options Trading
 Wealth building options trading - how to profit from share investments even if you buy at the top of the market.
 -
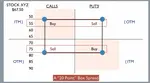
The Three Legged Box Spread - A Great Lifestyle Trade
 Whether you only have a few thousand or a large sum to invest, the Three Legged Box Spread is one of the best option trading strategies available today.
 -
XTR ProTrader Signals
-
The Double Calendar Spread
 The double calendar spread is a very safe option strategy which profits consistently - provided you know exactly what to do when price action threatens it.
 -
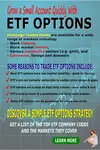
ETF Options - Why You Should Trade Them
 ETF Options when combined with the right options strategy, can be one of the best and safest ways to profit consistently from the financial markets.
 -
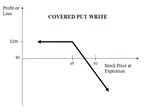
The Covered Put Option Strategy
 The covered put option strategy explained, with payoff diagram and examples. These are most suited to a bearish to neutral market.
 -
How to Use the VIX
 Knowing how to use the VIX should be essential for all traders whose portfolio of positions may be affected by general market sentiment.
 -
Using Options to Buy Stocks at Discount Prices
 Did you know that you could be using options to buy stocks so much cheaper than if you just went to your broker and simply bought them at market price?
 -
How Option Price Movements Effect Gains and Losses
Knowing about and understanding how options work is a potent arrow in a trader’s quiver. One of the things that people new to options must understand -
When can you trade Forex Options?
The forex market is the largest financial market in the world which works 24 hours, 5 days per week, if you consider the whole world as a single entity. -
Iron Condor Option Strategy
 In this iron condor option strategy we show you the best way to leg into positions safely and also to adjust your positions when they are threatened.
 -
What is a Straddle Option? A Great Delta Neutral Strategy!
 So what is a straddle option and why is it such a great options trading strategy? You don't have to pick market direction and can still profit very well.
 -
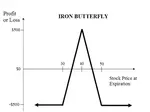
The Long Iron Butterfly - Credit Spreads on Steroids
The long iron butterfly is a range trading strategy and a variation of the Iron Condor. Both these strategies use two credit spreads using both calls and puts -
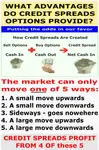
The Distinct Advantage Credit Spreads Are Known For
So what is the advantage credit spreads give us? This example will demonstrate how we can turn a losing trade into a profitable one. -
Box spreads Illustrated and Explained
Box spreads are an option trading strategy that involves purchasing a bull-call spread with a corresponding bear-put spread. The two vertical spreads have the same expiration dates and strike prices. -
Exotic Options Explained With Examples
Exotic options are typically more complex than regular options. They are most popularly traded on currency pairs but can also be traded on stock options, stock indexes, warrants and commodity options -
Hoadley Options Tools Review
 Hoadley Options Trading and Investment Tools is an Excel based tool that makes options risk analysis easy.
 -
Free Option Trading Software
So we've done some research for you and below, you'll find a summary of some of the best free option trading software available. -
Invest in Soxange and Multiply Earnings through Copying the Top Traders in this Social Network
Within the context of the online trading world, SoXange is one of the few trading platforms that draw all kinds of traders in droves to that online trading


Amazon Affiliate
Copyright © 2002- Options Trading Mastery. ALL RIGHTS RESERVED.
Other Recommended sites:
NaturalRelieved | European Travel Escape | Relationships Guide
New! Comments
Have your say about what you just read! Leave me a comment in the box below.