Search Options Trading Mastery:
- Home
- Stock Chart Analysis
- RSI Indicator
The RSI Indicator Explained
Why the RSI Indicator May be One of Your Most Powerful Options Trading Allies
This is about the RSI Indicator and how it can be used to influence your option trading decisions. The RSI is a "momentum indicator" and as such, is mainly used to confirm whether a trend is likely to continue or whether it is running out of steam - i.e. losing momentum. If you're a trend trader this makes it important.
The RSI is also known as a "leading indicator" (as opposed to a "lagging indicator") which means that it provides a signal that alerts us that a possible change of trend may be in the wind, before it occurs.
Finally, it is also called an "oscillator" because its signal bounces, or oscillates, between the two extreme points of +100 and -100. When it breaches 70 at either end it warns us that the security may be "over-bought" or "over-sold" as the case may be.
You should be very wary of entering a trade that is based on the assumption that the trend will continue when the RSI is hovering around these extremes. This is the primary purpose of the RSI indicator - to warn you that price action is possibly losing momentum.
How the RSI Indicator is Calculated
If you're a big picture person and the technical stuff bores you, then feel free to skip this section. If not, then here are the maths behind the RSI formula:
RSI = 100 - (100 / (1 + UP / DOWN))
Where UP = the average of the upward closing changes over the selected period, and DOWN = the average of the downward closing changes over the selected period.
So taking a 14 day RSI time period, we would:
1. Start with the closing prices for the last 14 days
2. Where the closing price of the security increased from the previous day, total the amounts of these increases. Divide this by 14 to arrive at the average UP closing prices.
3. Do the same thing for the days where the closing price is lower than the day before. This gives us the average DOWN closing price.
4. Divide the average UP closing change by the average DOWN closing change to get the relative strength.
5. Add 1 to this number.
6. Then divide the number from point 5 by 100.
7. Subtract this figure from 100.
You've just calculated the RSI! But why bother going to all this trouble when just about any charting program you can find these days will do it for you and present it as a graph.
How the RSI Indicator is Displayed
The RSI fluctuates between 0 and 100 in the form of a line chart which rises and falls. We can divided the RSI display into regions by drawing horizontal lines - one at 70 percent and the other at 30 percent, to indicate the warning zones. Some also include a line at 50 percent.
It's important not to confuse the terms "over-bought" and "over-sold" as meaning that too many shares have been bought or sold so that buyers or sellers (as the case may be) are about to re-enter the market.
This is not the case. It is all about momentum and momentum alone. It is simply a warning that the momentum of price action may not last so that the trend you are relying on is in danger of either decreasing or possibly even reversing.
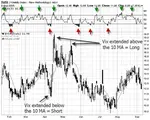
Have a look at this chart and note the RSI.

What Signals Does the RSI Indicator Give Us?
The RSI serves a dual purpose. Firstly, its current level in combination with the trend warns us if momentum may be failing because the stock is "over-bought" or "over-sold". The second use relates to divergences.
The Level of the RSI
An RSI that rises up through the oversold line (30%) after falling below it is considered bullish.
An RSI falling back through the overbought line (70%) after being above it is considered bearish.
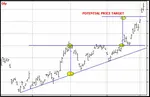
Divergences
When the RSI trend and the price action trend of the stock are in opposite directions there is a high probability of a potential change in trend. It is important to note that the RSI won't tell you when the change will occur, or how strong it will be, only that it may be coming.
A bullish divergence occurs when the stock falls to lower lows, but the RSI makes a higher low. The stock appears to be weak but in fact, is gaining strength and preparing for a reversal. Wait for validation then buy your call options when the stock begins to reverse.
A bearish divergence occurs when the stock rises to higher highs, but the RSI makes a lower high. The stock trend may appear to be strong but the indicator tells us it may be weakening and preparing to fall. Again, wait for confirmation before buying put options.
Take a look at the chart below for examples of RSI divergence.

The RSI indicator is one tool you should always pay attention to if you trade options with the trend.

**************** ****************
Return to Stock Chart Analysis Contents Page
Go to Option Trading Homepage

Add a Comment
We and other readers of this information site value your input.
You can also (optionally) include any graphics such as charts, if you wish.
Popular Articles
-
Near Riskless Trading Strategies
Near Riskless Trading strategies using options, allows you to use advanced arbitrage techniques for highly profitable, almost risk free results. -
Wealth Building Options Trading
 Wealth building options trading - how to profit from share investments even if you buy at the top of the market.
 -
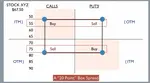
The Three Legged Box Spread - A Great Lifestyle Trade
 Whether you only have a few thousand or a large sum to invest, the Three Legged Box Spread is one of the best option trading strategies available today.
 -
XTR ProTrader Signals
-
The Double Calendar Spread
 The double calendar spread is a very safe option strategy which profits consistently - provided you know exactly what to do when price action threatens it.
 -
ETF Options - Why You Should Trade Them
 ETF Options when combined with the right options strategy, can be one of the best and safest ways to profit consistently from the financial markets.
 -
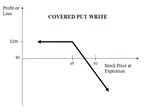
The Covered Put Option Strategy
 The covered put option strategy explained, with payoff diagram and examples. These are most suited to a bearish to neutral market.
 -
How to Use the VIX
 Knowing how to use the VIX should be essential for all traders whose portfolio of positions may be affected by general market sentiment.
 -
Using Options to Buy Stocks at Discount Prices
 Did you know that you could be using options to buy stocks so much cheaper than if you just went to your broker and simply bought them at market price?
 -
How Option Price Movements Effect Gains and Losses
Knowing about and understanding how options work is a potent arrow in a trader’s quiver. One of the things that people new to options must understand -
When can you trade Forex Options?
The forex market is the largest financial market in the world which works 24 hours, 5 days per week, if you consider the whole world as a single entity. -
Iron Condor Option Strategy
 In this iron condor option strategy we show you the best way to leg into positions safely and also to adjust your positions when they are threatened.
 -
What is a Straddle Option? A Great Delta Neutral Strategy!
 So what is a straddle option and why is it such a great options trading strategy? You don't have to pick market direction and can still profit very well.
 -
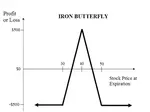
The Long Iron Butterfly - Credit Spreads on Steroids
The long iron butterfly is a range trading strategy and a variation of the Iron Condor. Both these strategies use two credit spreads using both calls and puts -
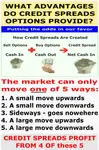
The Distinct Advantage Credit Spreads Are Known For
So what is the advantage credit spreads give us? This example will demonstrate how we can turn a losing trade into a profitable one. -
Box spreads Illustrated and Explained
Box spreads are an option trading strategy that involves purchasing a bull-call spread with a corresponding bear-put spread. The two vertical spreads have the same expiration dates and strike prices. -
Exotic Options Explained With Examples
Exotic options are typically more complex than regular options. They are most popularly traded on currency pairs but can also be traded on stock options, stock indexes, warrants and commodity options -
Hoadley Options Tools Review
 Hoadley Options Trading and Investment Tools is an Excel based tool that makes options risk analysis easy.
 -
Free Option Trading Software
So we've done some research for you and below, you'll find a summary of some of the best free option trading software available. -
Invest in Soxange and Multiply Earnings through Copying the Top Traders in this Social Network
Within the context of the online trading world, SoXange is one of the few trading platforms that draw all kinds of traders in droves to that online trading


Amazon Affiliate
Copyright © 2002- Options Trading Mastery. ALL RIGHTS RESERVED.
Other Recommended sites:
NaturalRelieved | European Travel Escape | Relationships Guide
New! Comments
Have your say about what you just read! Leave me a comment in the box below.