Search Options Trading Mastery:
- Home
- Stock Chart Analysis
- Technical Analysis of Stock Charts
Technical Analysis of Stock Charts
The Art and Science Behind Technical Analysis of Stock Charts
Technical analysis of stock charts is both a science and an art.
The science is in identifying all the chart patterns, candlestick formations, trends, channels etc. then adding indicators, bollinger bands and the like, to help determine the strength of a price move, or whether it is likely to consolidate or reverse.
The art is in developing the skill which, through practice, recognizes these things almost instinctively, so that you get an intuitive sense of what is about to happen. It's a bit like learning to play the piano. At first, you learn the theory, but good pianists only 'make it' through many hours of practice.
The idea is to be able to forecast future price movements of a financial instrument and adapt a trading strategy that fits your view.
For longer term investors, technical analysis of stock charts is usually distinguished from fundamental analysis of companies.
While fundamental analysis looks at financial accounting ratios and news events for a particular company, with a view to predicting whether its currently traded share price and dividend payments represent fair value, technical analysts believe that all this information is built into the price charts themselves.
While some technical analysts are longer term traders, most are concerned about short term opportunities. If you're good at technical analysis of stock charts and combine this with a knowledge of options trading together with personal discipline, you can do very well.
Technical Analysis of Stock Charts and Dow Theory
Around the turn of the twentieth century, the basis for modern technical analysis was born. After analysing stock charts over many years, Charles Dow wrote copiously about recurring price patterns and how these can be used to anticipate future moves.
The basis for Dow Theory relies on the following assumptions:
- That all investors act in their own interests and consequently, the financial markets are efficient - meaning that the economic principles of supply and demand reign supreme.
- That price movements are not totally random. If prices were random then it would be extremely difficult to profit using technical analysis.
In his book, "Schwager on Futures: Technical Analysis", Jack Schwager states:
"One way of viewing it is that markets may witness extended periods of random fluctuation, interspersed with shorter periods of non-random behavior. The goal of the chartist is to identify those periods (i.e. major trends)."
Fortunately, using the appropriate option trading strategies, we can profit, not only when a market is trending, but also when it is randomly fluctuating within a price range.
Some of the most useful tools for technical analysis of stock charts are:
- Bollinger Bands - for price volatility.
- Volume of shares traded - tells you a lot about probabilities.
- Trend lines - the trend is your friend, but it's not a friendship that will last forever.
- Stock Chart Patterns - identifying trend reversals and breakouts
- Support and Resistance lines
- Candlestick formations and patterns.
- Indicators - which either confirm our outlook, or warn against possible weakness in it.
Technical analysts consider the market to be 80% psychology and 20% scientific.
Fundamental analysts consider the market to be 20% psychology and 80% scientific.
Psychological or scientific may be open for debate, but there is no questioning the current price action of a security. After all, it is available for all to see and nobody doubts its legitimacy.
The price set by the market reflects the total perception of all participants - and we are not talking about amateurs here. These participants have considered (discounted) everything possible and settled on a price to buy or sell. The forces of supply and demand are at work.
By examining price action to determine which force is prevailing, technical analysis focuses directly on the bottom line: What is the price? Where has it been? Where is it going?
NEXT . . .
UsingTechnical Analysis for Swing Trading Options
Getting the Best Return on Risk

**************** ****************
Return to Stock Chart Analysis Main Page
Go to Option Trading Homepage

Popular Articles
-
Near Riskless Trading Strategies
Near Riskless Trading strategies using options, allows you to use advanced arbitrage techniques for highly profitable, almost risk free results. -
Wealth Building Options Trading
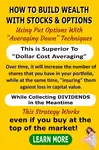 Wealth building options trading - how to profit from share investments even if you buy at the top of the market.
 -
The Three Legged Box Spread - A Great Lifestyle Trade
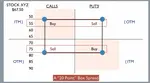 Whether you only have a few thousand or a large sum to invest, the Three Legged Box Spread is one of the best option trading strategies available for retail investors today.
 -
XTR ProTrader Signals
-
The Double Calendar Spread
 The double calendar spread is a very safe option strategy which profits consistently - provided you know exactly what to do when price action threatens it.
 -
ETF Options - Why You Should Trade Them
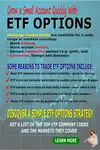 ETF Options when combined with the right options strategy, can be one of the best and safest ways to profit consistently from the financial markets.
 -
The Covered Put Option Strategy
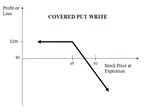 The covered put option strategy explained, with payoff diagram and examples. These are most suited to a bearish to neutral market.
 -
How to Use the VIX
 Knowing how to use the VIX should be essential for all traders whose portfolio of positions may be affected by general market sentiment.
 -
Using Options to Buy Stocks at Discount Prices
 Did you know that you could be using options to buy stocks so much cheaper than if you just went to your broker and simply bought them at market price?
 -
How Option Price Movements Effect Gains and Losses
Knowing about and understanding how options work is a potent arrow in a trader’s quiver. One of the things that people new to options must understand -
When can you trade Forex Options?
The forex market is the largest financial market in the world which works 24 hours, 5 days per week, if you consider the whole world as a single entity. -
Iron Condor Option Strategy
 In this iron condor option strategy we show you the best way to leg into positions safely and also to adjust your positions when they are threatened.
 -
What is a Straddle Option? A Great Delta Neutral Strategy!
 So what is a straddle option and why is it such a great options trading strategy? You don't have to pick market direction and can still profit very well.
 -
The Long Iron Butterfly - Credit Spreads on Steroids
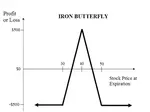 The long iron butterfly is a range trading strategy and a variation of the Iron Condor. Both these strategies use two credit spreads using both calls and puts
 -
The Distinct Advantage Credit Spreads Are Known For
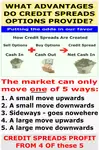 So what is the advantage credit spreads give us? This example will demonstrate how we can turn a losing trade into a profitable one.
 -
Box spreads Illustrated and Explained
Box spreads are an option trading strategy that involves purchasing a bull-call spread with a corresponding bear-put spread. The two vertical spreads have the same expiration dates and strike prices. -
Exotic Options Explained With Examples
Exotic options are typically more complex than regular options. They are most popularly traded on currency pairs but can also be traded on stock options, stock indexes, warrants and commodity options -
Hoadley Options Tools Review
 Hoadley Options Trading and Investment Tools is an Excel based tool that makes options risk analysis easy.
 -
Free Option Trading Software
So we've done some research for you and below, you'll find a summary of some of the best free option trading software available. -
Invest in Soxange and Multiply Earnings through Copying the Top Traders in this Social Network
Within the context of the online trading world, SoXange is one of the few trading platforms that draw all kinds of traders in droves to that online trading

Amazon Affiliate
Copyright © 2002- Options Trading Mastery. ALL RIGHTS RESERVED.
Other Recommended sites:
NaturalRelieved | European Travel Escape | Relationships Guide
New! Comments
Have your say about what you just read! Leave me a comment in the box below.