Search Options Trading Mastery:
- Home
- Stock Chart Analysis
- Triangle Patterns
Triangle Patterns Technical Analysis
How Stock Chart Triangle Patterns Can Generate Huge Profits With Options
Stock chart triangle patterns are classic setups for great option trades because they identify the consolidating price action that usually precedes a breakout. It is this breakout that we are interested in because it signals the beginning of a strong directional move where we can use options to leverage our potential profits.
Another strategy that can be used on conjunction with triangle patterns is the straddle - an equal number of both call and put options on the same security with a longer term to expiration. For these types of trades, we are not interested in the breakout but the period just prior to it.
Around this time, the stock price is going nowhere and consequently, option implied volatility (IV) should be relatively low. Once the breakout occurs, IV can explode and as the stock moves, either the calls or puts (but not both) will not only be in-the-money, but the option prices will be inflated to such an extent that the winning side pays for the losing side and then some.
The Symmetrical Triangle Pattern
This pattern occurs when you have converging support and resistance lines. Extending the lines will form a peak and hence, the triangle pattern. The symmetrical triangle is a sideways pattern which is usually formed over between 20 to 50 days.
We do not trade directionally within this pattern because the price action is being compressed and the volatility is going out of the stock. Volume should also be decreasing as the buyers and sellers can't make a decision.
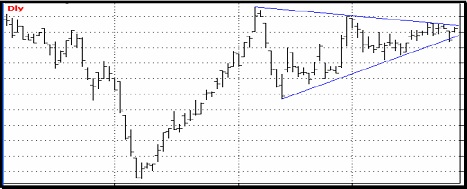
It is quite common for the stock to break out during the final one-third of the pattern and this is the ideal time to enter your straddle position if that's your strategy and the price is right.
If we are planning on trading the breakout as a directional play, something to remember is that the likely direction of the breakout is usually in the direction of the medium term trend. Once the breakout occurs, we enter the trade.
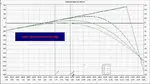
The thing about triangle patterns is, that you can also use them to predict the potential target price of the underlying. This means you may be able to hold onto your options positions until it reaches the target, or close to it.
You could go long the options in whichever direction the price breaks out, or you could choose a credit spread that relies on the price to stay away from the opposite direction in order to profit.

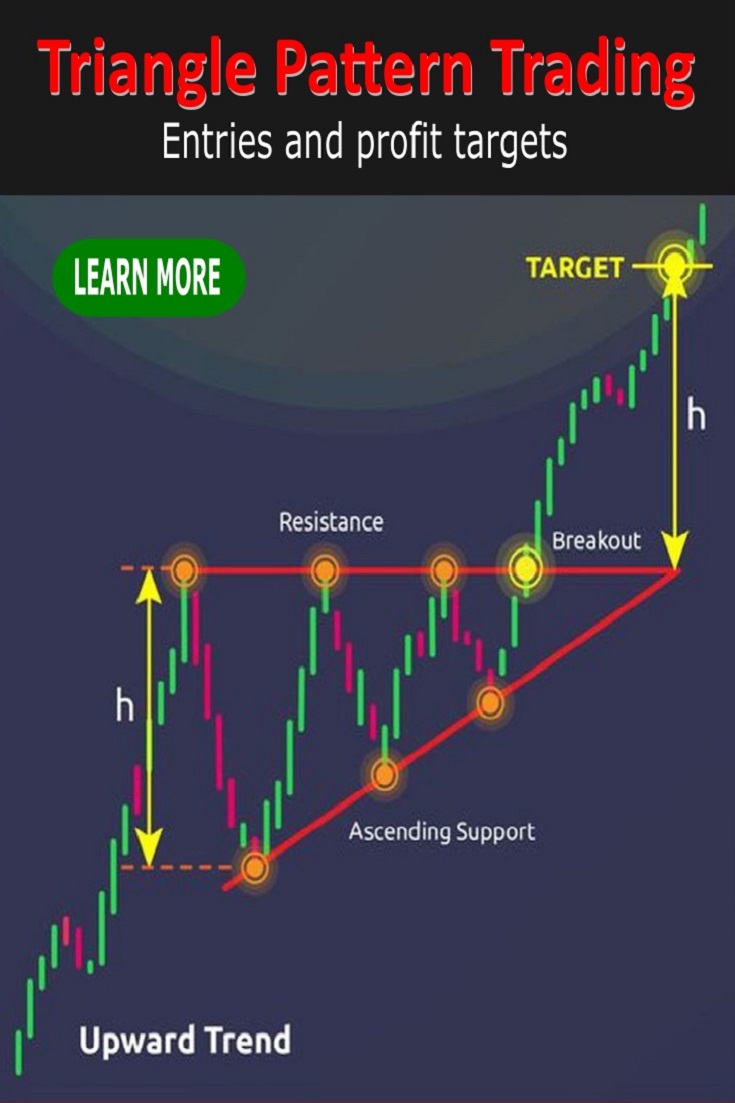
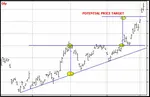
The Ascending Triangle Pattern
The ascending triangle heralds a potential upward thrust in price action once a breakout occurs. It has an horizontal resistance line together with an ascending line of support drawn under the troughs on your chart.
Again, this pattern is normally formed over 20 to 50 days and we wait until the breakout is confirmed before we enter a trade.
In my experience, ascending triangles have the greatest probability of breaking down in the opposite direction rather than breaking upwards, because the resistance line can sometimes prove to be too strong.

As the price action nears the apex of the triangle it is being compressed and should not be traded. But once the security breaks out of the triangle and does so following an already established upwards trendline, the probability of the stock continuing north is high and therefore ripe for entering call options positions or using put option credit spreads.
If you take a look at the chart below, you'll also observe that sometimes the stock can retest the resistance line (which now becomes support) after it has broken through it. As with the symmetric triangle, we can also use the ascending triangle to anticipate a target price for the underlying.

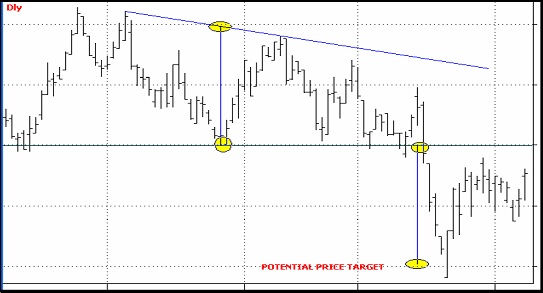
The Descending Triangle Pattern
I have found this to be one of the most reliable and profitable of the triangle patterns, to trade. Once the underlying breaks downwards from the descending triangle, the subsequent fall can be quite dramatic - and profitable - if you're long put options. As with the symmetric and ascending patterns, we look for one formed over 20 to 50 days and prepare for the breakout.
Once the breakout is confirmed, we can either take out a debit put option position or spread, or if we want a less profitable but more sure thing, use a call option credit spread instead.
Triangle patterns should NEVER be used for range trading strategies such as iron condors or calendar spreads.
**************** ****************
Return to Stock Chart Analysis Contents Page
Go to Option Trading Homepage

Popular Articles
-
Near Riskless Trading Strategies
Near Riskless Trading strategies using options, allows you to use advanced arbitrage techniques for highly profitable, almost risk free results. -
Wealth Building Options Trading
 Wealth building options trading - how to profit from share investments even if you buy at the top of the market.
 -
The Three Legged Box Spread - A Great Lifestyle Trade
 Whether you only have a few thousand or a large sum to invest, the Three Legged Box Spread is one of the best option trading strategies available for retail investors today.
 -
XTR ProTrader Signals
-
The Double Calendar Spread
 The double calendar spread is a very safe option strategy which profits consistently - provided you know exactly what to do when price action threatens it.
 -
ETF Options - Why You Should Trade Them
 ETF Options when combined with the right options strategy, can be one of the best and safest ways to profit consistently from the financial markets.
 -
The Covered Put Option Strategy
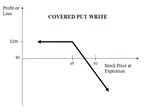 The covered put option strategy explained, with payoff diagram and examples. These are most suited to a bearish to neutral market.
 -
How to Use the VIX
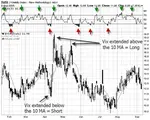 Knowing how to use the VIX should be essential for all traders whose portfolio of positions may be affected by general market sentiment.
 -
Using Options to Buy Stocks at Discount Prices
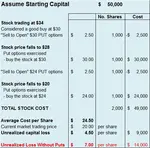 Did you know that you could be using options to buy stocks so much cheaper than if you just went to your broker and simply bought them at market price?
 -
How Option Price Movements Effect Gains and Losses
Knowing about and understanding how options work is a potent arrow in a trader’s quiver. One of the things that people new to options must understand -
When can you trade Forex Options?
The forex market is the largest financial market in the world which works 24 hours, 5 days per week, if you consider the whole world as a single entity. -
Iron Condor Option Strategy
 In this iron condor option strategy we show you the best way to leg into positions safely and also to adjust your positions when they are threatened.
 -
What is a Straddle Option? A Great Delta Neutral Strategy!
 So what is a straddle option and why is it such a great options trading strategy? You don't have to pick market direction and can still profit very well.
 -
The Long Iron Butterfly - Credit Spreads on Steroids
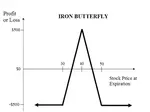 The long iron butterfly is a range trading strategy and a variation of the Iron Condor. Both these strategies use two credit spreads using both calls and puts
 -
The Distinct Advantage Credit Spreads Are Known For
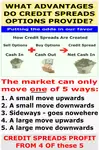 So what is the advantage credit spreads give us? This example will demonstrate how we can turn a losing trade into a profitable one.
 -
Box spreads Illustrated and Explained
Box spreads are an option trading strategy that involves purchasing a bull-call spread with a corresponding bear-put spread. The two vertical spreads have the same expiration dates and strike prices. -
Exotic Options Explained With Examples
Exotic options are typically more complex than regular options. They are most popularly traded on currency pairs but can also be traded on stock options, stock indexes, warrants and commodity options -
Hoadley Options Tools Review
 Hoadley Options Trading and Investment Tools is an Excel based tool that makes options risk analysis easy.
 -
Free Option Trading Software
So we've done some research for you and below, you'll find a summary of some of the best free option trading software available. -
Invest in Soxange and Multiply Earnings through Copying the Top Traders in this Social Network
Within the context of the online trading world, SoXange is one of the few trading platforms that draw all kinds of traders in droves to that online trading

Amazon Affiliate
Copyright © 2002- Options Trading Mastery. ALL RIGHTS RESERVED.
Other Recommended sites:
NaturalRelieved | European Travel Escape | Relationships Guide
New! Comments
Have your say about what you just read! Leave me a comment in the box below.