Search Options Trading Mastery:
- Home
- Advanced Strategies
- What is a Straddle Option
What is a Straddle Option? A Great Delta Neutral Strategy
When asked "what is a straddle option and what do you love about it?" I am reminded that one of the things that I love about the options straddle strategy, is that it's non-directional.
This means that you can make money without forecasting market direction. In other words, it doesn't matter whether the stock price goes up or down in the near future - you can still make money either way, as long as it moves somewhere.
Since most stock prices are on the move, this means that the Straddle options strategy is worth taking an interest in.
You can start with this video, or if you're more of a reader, you'll find the script, plus diagrams, below the video. Enjoy!
What is a Straddle Option Structure?
The idea behind a straddle is that you simultaneously purchase
the same number of call and put options, with the same expiration date.
The plan is, that thanks to option implied volatility and an option greek called "the delta",
the profit from the winning option will more than compensate for the
loss on the losing one, with a good overall profit being realized.
The options straddle trade is a "slow moving" trade that can take anywhere from a few days up to a month to do its thing. It works best on stocks that are in a period of price consolidation with the expectation that a breakout followed by significant price action may be coming soon.
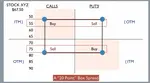
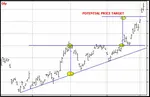
What is a straddle option chart pattern that works best for this strategy?
If you are a technical trader, one of the best chart patterns I have found for straddle trade setups, are what are commonly known as "triangle" or "wedge" formations. This is where the recent highs and lows of the daily bar charts are coming together.
In other
words, the highs are getting lower while the lows are getting higher, so
that if you draw a trendline over the highs and lows, you'll see them
converging into a point. You'll see an example of a triangle pattern (ascending triangle) further down this page.
You want to trade an options straddle as near as possible to the convergence of the two trendlines, even at the point where the breakout begins will still work.
The best straddle breakouts come after you see this pattern forming for about 3 months. Anything shorter than that, may result in a breakout that doesn't have sufficient momentum to give you a decent profit.
What is a straddle option strategy's best options expiration date?
Another vital thing when taking out straddle options trades, is that you need to ensure that the options you buy have at least 90 days to expiration. If you do this during a period of price consolidation, such as in the triangle pattern above, the option prices are likely to be the cheapest around that time, due to low price volatility. This is ideal for straddle trades.
What is a straddle option trade's downside?
The downside of options straddle positions is that they cost more to enter, than other trading strategies such as spreads. Nevertheless, on markets where option contracts only cover 100 shares, they are still quite affordable.
If cost is a barrier to you, you might like to consider an alternative strategy called Victory Spreads. A double Victory Spread - done with both calls and puts, achieves exactly the same result as the options straddle but only risking a pittance by comparison.
You also want to avoid stocks that are historically slow moving, because the whole idea behind a straddle is to anticipate a short term price breakout that moves far enough before expiration date, to give you a net profit.
Another indicator that a price breakout could be imminent, is an upcoming earnings report, say, in about 2-3 weeks. When an earnings report is pending, pay attention to the implied volatility, as option prices tend to become more expensive just before an earnings report is released.
Alternatively, a large movement in the overall market due to current econonmic conditions can also affect individual stocks - but under general volatile market conditions you might be better focussing your straddle play on index related ETFs such as the SPY.
Coming back to "triangle" patterns, there are three main types. Where the highs and lows are converging, this is called a "symmetrical triangle". However, you often see the lows getting higher, but the highs being equal because they are hitting a resistance level. This is called an "ascending triangle" (see example below).
The reverse of this is the third type, namely, descending triangles. These are ideal conditions to implement a straddle strategy.
The final thing you want to check before placing your options straddle position, is the "implied volatility" in the option prices, compared to the "historical volatility" of the stock price. Ideally, the former should be lower than the latter. Any decent options broker will be able to provide this information.

Finding Triangle Patterns - The Easy and the Hard Way
Wading through a long list of stock charts to try and find triangle patterns can be a very tedious process. But if you have software or a broker service that allows stock scanning, you can make the process much quicker.
Here's what you can do.
There is an indicator known as the ADX, or "Average Directional Index". It is usually used in conjunction with the +DMI and -DMI indicators, but for our purpose we can ignore these. The general rule is, that when the ADX crosses above 15 the market is likely to break out. Below 15 the market is consolidating.
So if you, or your broker, have a scanning facility, you would set your stock price filter to between $20 and $10k and your ADX filter to crossing above 15. It will produce a list of stocks that qualify for both parameters.

Checklist For Finding Straddle Options Candidates
Here is a summary of the conditions you should expect to identify before you consider placing a straddle trade:
1. Earnings Reports - Options Implied volatilities should be lower in between company earnings reports, as there are no major announcements or conferences expected which might energise the price action. If you're scanning the market for straddle trade opportunities, you should begin your search by looking at stocks with upcoming earnings reports during the next fortnight.
2. Looking at a bar or candlestick chart of the underlying, you should be able to observe price consolidation. Comparing the size of the current daily bars with those in the past, it should be apparent that these bars are smaller than the historical ones.
You want something that has had big moves in the past (which indicates that this stock's price DOES move) but now the price action is relatively quiet due to smaller intra-day price moves. In consolidation mode stocks also tend to have lower volumes. Under these conditions the options will normally be cheaper.
You will often find this phenomenon close to the end point of a "triangle" chart pattern, as described above.
3. The options must be cheap. By "cheap" we mean that the implied volatility in the at-the-money option prices must be less than the historical volatility of the underlying security. Any good options broker should be able to deliver this information. For example, with OptionsXpress, you can look at a price chart in "Volatility View" mode and easily compare IV with HV.
If all the above conditions are in place, you have an ideal setup for an options straddle trade.
The Options Straddle is one of the safest and most stable option trading strategies available, because you've eliminated the need to predict market direction. It does have some risk, namely, that the stock goes nowhere, in which case, time decay (theta) on your bought positions will work against you.
But if you've purchased when the implied volatility is low and price is cheap, your losses will be minimal. Straddle profits are theoretically unlimited, but anywhere between 20 - 50 percent per trade is quite easily attainable.
Straddle Alternative
There is an alternative that works exactly like the straddle but with this difference - they are much cheaper to take positions on and therefore, the amount you lose if the stock goes nowhere is much less. They're also more flexible, cheaper to put on and carry less risk. These nice little setups are called Victory Spreads.
****************** ******************
Return to Option Trading Strategies
Return to Option Trading Homepage

Add a Comment
We and other readers of this information site value your input.
You can also (optionally) include any graphics such as charts, if you wish.
Popular Articles
-
Near Riskless Trading Strategies
Near Riskless Trading strategies using options, allows you to use advanced arbitrage techniques for highly profitable, almost risk free results. -
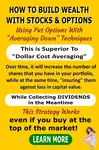
Wealth Building Options Trading
 Wealth building options trading - how to profit from share investments even if you buy at the top of the market.
 -
The Three Legged Box Spread - A Great Lifestyle Trade
 Whether you only have a few thousand or a large sum to invest, the Three Legged Box Spread is one of the best option trading strategies available today.
 -
XTR ProTrader Signals
-
The Double Calendar Spread
 The double calendar spread is a very safe option strategy which profits consistently - provided you know exactly what to do when price action threatens it.
 -
ETF Options - Why You Should Trade Them
 ETF Options when combined with the right options strategy, can be one of the best and safest ways to profit consistently from the financial markets.
 -
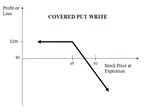
The Covered Put Option Strategy
 The covered put option strategy explained, with payoff diagram and examples. These are most suited to a bearish to neutral market.
 -
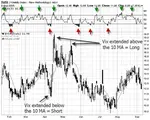
How to Use the VIX
 Knowing how to use the VIX should be essential for all traders whose portfolio of positions may be affected by general market sentiment.
 -
Using Options to Buy Stocks at Discount Prices
 Did you know that you could be using options to buy stocks so much cheaper than if you just went to your broker and simply bought them at market price?
 -
How Option Price Movements Effect Gains and Losses
Knowing about and understanding how options work is a potent arrow in a trader’s quiver. One of the things that people new to options must understand -
When can you trade Forex Options?
The forex market is the largest financial market in the world which works 24 hours, 5 days per week, if you consider the whole world as a single entity. -
Iron Condor Option Strategy
 In this iron condor option strategy we show you the best way to leg into positions safely and also to adjust your positions when they are threatened.
 -
What is a Straddle Option? A Great Delta Neutral Strategy!
 So what is a straddle option and why is it such a great options trading strategy? You don't have to pick market direction and can still profit very well.
 -
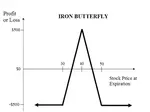
The Long Iron Butterfly - Credit Spreads on Steroids
The long iron butterfly is a range trading strategy and a variation of the Iron Condor. Both these strategies use two credit spreads using both calls and puts -
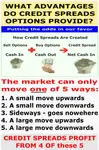
The Distinct Advantage Credit Spreads Are Known For
So what is the advantage credit spreads give us? This example will demonstrate how we can turn a losing trade into a profitable one. -
Box spreads Illustrated and Explained
Box spreads are an option trading strategy that involves purchasing a bull-call spread with a corresponding bear-put spread. The two vertical spreads have the same expiration dates and strike prices. -
Exotic Options Explained With Examples
Exotic options are typically more complex than regular options. They are most popularly traded on currency pairs but can also be traded on stock options, stock indexes, warrants and commodity options -
Hoadley Options Tools Review
 Hoadley Options Trading and Investment Tools is an Excel based tool that makes options risk analysis easy.
 -
Free Option Trading Software
So we've done some research for you and below, you'll find a summary of some of the best free option trading software available. -
Invest in Soxange and Multiply Earnings through Copying the Top Traders in this Social Network
Within the context of the online trading world, SoXange is one of the few trading platforms that draw all kinds of traders in droves to that online trading


Amazon Affiliate
Copyright © 2002- Options Trading Mastery. ALL RIGHTS RESERVED.
Other Recommended sites:
NaturalRelieved | European Travel Escape | Relationships Guide
New! Comments
Have your say about what you just read! Leave me a comment in the box below.