Search Options Trading Mastery:
Ratio Trading with Options
Ratio Trading - A Recently Developed Option Trading Strategy
Ratio trading is a relatively new options trading technique, used only by about the top one percent of all traders in the world. Simply put, it is taking two different but related financial instruments and trading them against each other.
It needs to be distinguished from ratio spread trading because it is not the same thing. Ratio spreads are covered elsewhere on this site.
We start by looking at stock charts with a twist. Instead of putting up just one financial instrument on our charts, we create a chart that compares the strength of one financial instrument against another.
Most good broker trading platforms, such as ThinkorSwim, allow you to do this. One appealing feature of ratio trading is, that all the usual rules for chart technical analysis, work even better with these types of charts.
There is a wide choice of financial instruments that you can compare. You can compare a variety of stock index related ETFs with one another, or individual stocks against their relevant index.
For example, if you trade the US markets, you may wish to compare the performance of American Express against the Dow 30 index, which it forms part of. You can even do it with foreign currency ETFs, comparing one currency against the other.
The important thing is to look for well defined trends. If there is any doubt whether a trend exists, leave it alone.
The inherent weakness that comes with comparing one financial instrument against another, is that both may be trending in the same direction. Consequently, a ratio chart that shows one stock or Exchange Traded Fund (ETF) trending against the other may not necessarily mean that the price action of the favorable one is guaranteed to be moving in your anticipated direction.
For example, two stock ETFs might be dropping together, but one is decisively plummeting while the other is just gently sliding south. A ratio chart would show the second ETF outperforming the first ETF, but if you went long the second one on this basis alone, you could lose money.
So you still need to do your analysis in the context of the larger market.
Ratio Trading With Short ETFs
Short Exchange Traded Funds (ETFs) have only come into existence in more recent times. Consequently, they are not well known. Yet the dynamics between the long and short ETFs is nothing short of dramatic!
Short ETFs are index related funds whose portfolio increases in value when the price action of the index falls. This is because they have leveraged derivatives and futures contracts related to the index.
- There are many short ETFs.
- There are also one-time ETFs, two-time, or three-time ETFs.
- The 3-time ETF means that for every one point rise in the long ETF, the short ETF loses 3 points and vice versa.
For the purpose of ratio trading, you would only be interested in one-time ETFs.
Here's an example:
The long ETF for the S&P500 index is called the SPY.
The short ETF for the S&P500 is called the SDS.
So we plot the SPY against the SDS on a chart.
Because these financial instruments work opposite to each other, there will be times when their respective line graphs cross over. We call this the equilibrium. But the area of the chart we are most interested in, is when we notice a change of direction beginning to form.
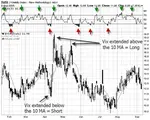
Take a look at the image of the SPY/SDS ratio chart below.

The SPY is plotted as the black line while the SDS is the blue line. You'll notice that as the price action on the SPY begins to reverse, so price volatility becomes greater (note the jagged black lines at the top).
However, at the same time, the price volatility for the SDS is not so volatile, even though it is supposed to mimic the moves of the SPY in reverse.
When you get high volatility on the upside, together with lower volatility on the downside, it provides a strong clue that the market is about to reverse and, in this case, go down.
Your strategy at this point would be to go long the SDS and short the SPY. Your target will be the equilibrium point (where the lines cross). Using options, you can leverage your profits at both ends.
The same strategy can be employed when the SDS reaches a peak while the SPY is bottoming out. You look for high volatility on the upside of the chart, together with lower volatility on the downside - a strong clue that the market is about to reverse.
Ratio trading when understood correctly, is a very powerful way to pick market reversals. Using in-the-money options with a high delta, you can make the most of these trading opportunities and take home huge profits.
Want to know more?
The ratio trading system is explained in greater detail, with examples, in the last three modules of the Winning Trade System. It is a series of 16 advanced level options trading videos by veteran trader David Vallieres.
This technique is also included in more detail in his advanced course called Near Riskless Trading.

******************* *******************
Return to Option Trading Strategies
Go to Option Trading Homepage

Popular Articles
-
Near Riskless Trading Strategies
Near Riskless Trading strategies using options, allows you to use advanced arbitrage techniques for highly profitable, almost risk free results. -
Wealth Building Options Trading
 Wealth building options trading - how to profit from share investments even if you buy at the top of the market.
 -
The Three Legged Box Spread - A Great Lifestyle Trade
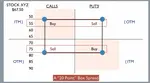 Whether you only have a few thousand or a large sum to invest, the Three Legged Box Spread is one of the best option trading strategies available for retail investors today.
 -
XTR ProTrader Signals
-
The Double Calendar Spread
 The double calendar spread is a very safe option strategy which profits consistently - provided you know exactly what to do when price action threatens it.
 -
ETF Options - Why You Should Trade Them
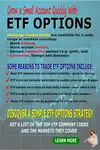 ETF Options when combined with the right options strategy, can be one of the best and safest ways to profit consistently from the financial markets.
 -
The Covered Put Option Strategy
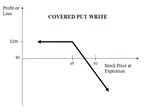 The covered put option strategy explained, with payoff diagram and examples. These are most suited to a bearish to neutral market.
 -
How to Use the VIX
 Knowing how to use the VIX should be essential for all traders whose portfolio of positions may be affected by general market sentiment.
 -
Using Options to Buy Stocks at Discount Prices
 Did you know that you could be using options to buy stocks so much cheaper than if you just went to your broker and simply bought them at market price?
 -
How Option Price Movements Effect Gains and Losses
Knowing about and understanding how options work is a potent arrow in a trader’s quiver. One of the things that people new to options must understand -
When can you trade Forex Options?
The forex market is the largest financial market in the world which works 24 hours, 5 days per week, if you consider the whole world as a single entity. -
Iron Condor Option Strategy
 In this iron condor option strategy we show you the best way to leg into positions safely and also to adjust your positions when they are threatened.
 -
What is a Straddle Option? A Great Delta Neutral Strategy!
 So what is a straddle option and why is it such a great options trading strategy? You don't have to pick market direction and can still profit very well.
 -
The Long Iron Butterfly - Credit Spreads on Steroids
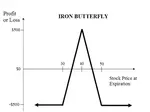 The long iron butterfly is a range trading strategy and a variation of the Iron Condor. Both these strategies use two credit spreads using both calls and puts
 -
The Distinct Advantage Credit Spreads Are Known For
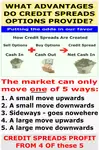 So what is the advantage credit spreads give us? This example will demonstrate how we can turn a losing trade into a profitable one.
 -
Box spreads Illustrated and Explained
Box spreads are an option trading strategy that involves purchasing a bull-call spread with a corresponding bear-put spread. The two vertical spreads have the same expiration dates and strike prices. -
Exotic Options Explained With Examples
Exotic options are typically more complex than regular options. They are most popularly traded on currency pairs but can also be traded on stock options, stock indexes, warrants and commodity options -
Hoadley Options Tools Review
 Hoadley Options Trading and Investment Tools is an Excel based tool that makes options risk analysis easy.
 -
Free Option Trading Software
So we've done some research for you and below, you'll find a summary of some of the best free option trading software available. -
Invest in Soxange and Multiply Earnings through Copying the Top Traders in this Social Network
Within the context of the online trading world, SoXange is one of the few trading platforms that draw all kinds of traders in droves to that online trading

Amazon Affiliate
Copyright © 2002- Options Trading Mastery. ALL RIGHTS RESERVED.
Other Recommended sites:
NaturalRelieved | European Travel Escape | Relationships Guide
New! Comments
Have your say about what you just read! Leave me a comment in the box below.