Search Options Trading Mastery:
- Home
- Index Options
- the VIX indicator
The VIX Indicator
The VIX Indicator And Its Role In The Stock Market
The VIX indicator, also known as the Volatility Index indicator, is a tool used by US stock market analysts to determine its overall bearish potential. For this reason, it is sometimes called the "fear guage". The calculation of this index is very complex, but highly valuable, as it provides warning signals to investors of future overall market direction.
What Is the VIX Indicator?
It is a measure of the implied volatility level of a wide selection of put options with an expiration period during the next 30 days. This is then annualised. The general idea is, that as more put options are being purchased by fund managers as a hedging vehicle against falling stocks, their price will increase due to increased demand and thus their "implied volatilty" will rise.
Not only so, but call options are included in the calculation as well. Fund managers will be more inclined to sell call options when there is an expectation that prices will fall in the near future.
Options from stocks that comprise the broad based S&P 500 index are used to create the VIX. This is because these underlying top 500 US companies provide the best prediction for any upcoming probable risk or market volatility.
Basically the VIX Indicator will begin rising in times of financial uncertainty and it will reduce when investors are complacent. This makes it a good warning sign of potential market sell-offs.
How is it Calculated?
A new method of calculating the VIX indicator was adopted in 2003, which used the next and near put and call alternatives to compute the Implied volatility for the S&P 500 Index.
There is only a very slight difference between the two. Typically, the near term options will have a validity of only a week, while the next-term options will have a validity of up to 12 months. Every price of an option will have an implied volatility, also called the standard deviation.
The volatility indicator therefore calculates a subjective implied volatility average in order to determine the anticipated volatility in 30 days, for the S&P option. These days are not trading days but calendar days.
Here is how to calculate:
• Choose the next term and near term put and call options for calculating.
• Compute the implied volatility for every option selected.
• Compute a weighted average of the implied volatility of the options you picked, then multiply it by 100.
The Performance of The Volatility Index On The Stock Market
Since the VIX Indicator is closely related to the stock market, it will be affected by the movement of certain attributes of it. If any factor increases, the Volatility Index will either increase or decrease, and if the factor decreases, the VIX will also be affected.
Mostly, the VIX Indicator will be used for the US Stock Market and generally speaking, but not always, it will rise when stocks are declining and while the market is optimistic, it will decline. If there is an advancing stock market, then naturally it is considered less risky to buy shares.
However, when the probability that a market reversal is high, along with this perceived higher risk will come an increase in option implied volatility. For that, the indirect volatility will be vulnerable to the directional shift in the market.
A subsequent market crash will boost the options’ demand and as a result, the costs of the options will increase. The implied volatility will also increase as the decline of the stock market extends.
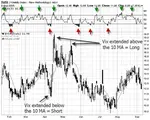
Spikes, Ranges and Trends
Analysts have established that the CBOE VIX Indicator chart shows defined, extended trends along with irregular spikes. This is believed to happen roughly every 4 years.
Over a given period of time, even though the 200 day moving average has remained constant, the VIX will have changed. The ranges will be shifted higher, the trend will fluctuate and the spike will also move periodically.
Given that the S&P 500 index moved more than 1400 points as 2006 ended, the VIX Indicator still traded between the range of 10 to 15. This is lower, than the levels observed in 2010, however, the volatility Index shot up between January and June of 2007. As of July of 2007 to October, 2008, the range of the VIX was higher.
If the VIX indicator is high, it will suggest that there may be panic in the stock market by the investors. When bullish times come there will be less fear so that there will be limited demand for fund managers to buy put options.
In summary, the VIX indicator helps determine if the stock market is safe for investment or if it is risky to be involved in it. Savvy options traders can use this information in conjunction with whatever options strategy or trading approach they are employing.
The advantages of using the VIX are more fully explained in the popular Trading Pro System educational videos.

**************** ****************
Return to Index Options Contents Page
Go to Option Trading Homepage

Popular Articles
-
Near Riskless Trading Strategies
Near Riskless Trading strategies using options, allows you to use advanced arbitrage techniques for highly profitable, almost risk free results. -
Wealth Building Options Trading
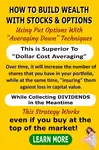 Wealth building options trading - how to profit from share investments even if you buy at the top of the market.
 -
The Three Legged Box Spread - A Great Lifestyle Trade
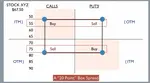 Whether you only have a few thousand or a large sum to invest, the Three Legged Box Spread is one of the best option trading strategies available for retail investors today.
 -
XTR ProTrader Signals
-
The Double Calendar Spread
 The double calendar spread is a very safe option strategy which profits consistently - provided you know exactly what to do when price action threatens it.
 -
ETF Options - Why You Should Trade Them
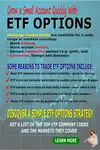 ETF Options when combined with the right options strategy, can be one of the best and safest ways to profit consistently from the financial markets.
 -
The Covered Put Option Strategy
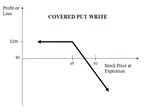 The covered put option strategy explained, with payoff diagram and examples. These are most suited to a bearish to neutral market.
 -
How to Use the VIX
 Knowing how to use the VIX should be essential for all traders whose portfolio of positions may be affected by general market sentiment.
 -
Using Options to Buy Stocks at Discount Prices
 Did you know that you could be using options to buy stocks so much cheaper than if you just went to your broker and simply bought them at market price?
 -
How Option Price Movements Effect Gains and Losses
Knowing about and understanding how options work is a potent arrow in a trader’s quiver. One of the things that people new to options must understand -
When can you trade Forex Options?
The forex market is the largest financial market in the world which works 24 hours, 5 days per week, if you consider the whole world as a single entity. -
Iron Condor Option Strategy
 In this iron condor option strategy we show you the best way to leg into positions safely and also to adjust your positions when they are threatened.
 -
What is a Straddle Option? A Great Delta Neutral Strategy!
 So what is a straddle option and why is it such a great options trading strategy? You don't have to pick market direction and can still profit very well.
 -
The Long Iron Butterfly - Credit Spreads on Steroids
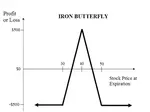 The long iron butterfly is a range trading strategy and a variation of the Iron Condor. Both these strategies use two credit spreads using both calls and puts
 -
The Distinct Advantage Credit Spreads Are Known For
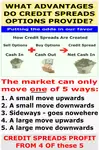 So what is the advantage credit spreads give us? This example will demonstrate how we can turn a losing trade into a profitable one.
 -
Box spreads Illustrated and Explained
Box spreads are an option trading strategy that involves purchasing a bull-call spread with a corresponding bear-put spread. The two vertical spreads have the same expiration dates and strike prices. -
Exotic Options Explained With Examples
Exotic options are typically more complex than regular options. They are most popularly traded on currency pairs but can also be traded on stock options, stock indexes, warrants and commodity options -
Hoadley Options Tools Review
 Hoadley Options Trading and Investment Tools is an Excel based tool that makes options risk analysis easy.
 -
Free Option Trading Software
So we've done some research for you and below, you'll find a summary of some of the best free option trading software available. -
Invest in Soxange and Multiply Earnings through Copying the Top Traders in this Social Network
Within the context of the online trading world, SoXange is one of the few trading platforms that draw all kinds of traders in droves to that online trading

Amazon Affiliate
Copyright © 2002- Options Trading Mastery. ALL RIGHTS RESERVED.
Other Recommended sites:
NaturalRelieved | European Travel Escape | Relationships Guide
New! Comments
Have your say about what you just read! Leave me a comment in the box below.