<meta name="p:domain_verify" content="a18b2c1f8e33804ac933d39eaa644b90"/>
Search Options Trading Mastery:
- Home
- Stock Chart Analysis
- Stochastic Indicator
Stochastic Indicator Buy and Sell Signals
Using the Stochastic Indicator The Correct Way
The Stochastic indicator, often called CStats, is a chart study that is all too misunderstood in the trading community. The original Stochastic oscillator was created by Dr. George C. Lane.
First, the Technical Stuff
Feel free to skip this part if you're not technically minded. It won't make any difference to using it effectively.
Oscillators are calculated using the Open, High, Low and Close values of a security's price action. It is plotted using two lines - a fast line (called %K) and a Slow line (called %D). The fast line (%K) is more sensitive to price movement than the slow line, because the slow line (%D) is actually a moving average of the fast line.
For those who are keen on mathematics, you will find the calculation for the stochastic indicator below:

The above formula is for the fast stochastic oscillator, but it includes a lot of price 'noise'. Consequently, it has become commonplace to further refine this formula to change it into a Slow Stochastic line.
This process is achieved by taking the Fast CStat's %D as the Slow CStat's %K. This new %K is then known as the Slow %K which is further smoothed to produce the Slow %D.
All this would seem to suggest that the CStat's are a lagging rather than a predictive indicator.
Fortunately, these days any good charting software will have all the above included so that no tedious calculations are necessary.
Now let's take a look at what the stochastic indicator shows us and how we can use it. On a daily chart, we are going to set our parameters at a 5 period, with a smoothing of 5 days.
You should also set a bullish zone above 80 and a bearish zone below 20.
Using the CStats for Buy and Sell Signals
Using the CStats we can receive valuable warnings of possible turning points in price action if we use it correctly. First, we note that if the CStats are in zone above 80 and the two lines are crossing over and pointing downwards then the underlying could possibly be 'overbought' and ready for a reversal, if not already doing so.
Bear in mind that crossovers can occur anywhere on the graph, but have more significance if they occur in the overbought or oversold zones.
Here are two examples of how this works. Note that overall the underlying stocks in this case, is in a sideways trend. This is the environment where CStats provide the most reliable signals - in a sideways trending channel.


If you should try to use the CStats on a strongly Up or Down trending security, you run the risk of getting FALSE signals. This is because the CStats can cross over even though the trend is continuing and all it is doing is simply responding to the stock's price momentum weakening.
In some cases, the stochastic indicator under these circumstances can indicate temporary short term counter trends, but the risk of being wrong is greater.
Another point worth noting is, that when the market is trending it's not uncommon for the CStat line to repeatedly cross over and back within in a zone, like 'spaghetti'. This sideways CStats movement can last several weeks and give false signals.
So you can see there is a strong case for only using the stochastic indicator on a sideways trending financial instrument.
Using the Stochastic Indicator to Enter Trades
Let's assume we have observed a sideways trending channel. To qualify for a channel, we need three points of validation - a high, then a low, followed by another high close to the same level, or vice versa.
Now we have support and resistance levels mapped on our chart. Often these levels gravitate to round numbers, e.g. $32.00 and $30.00.
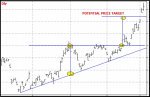
Let's observe the image below to demonstrate how the CStat oscillator provides entry point warning signals.
We can readily observe that the channel is going between a support and resistance line which happen to be (as they often are) around round numbers - $30 - $32.
You'll notice at the last entry signal (coloured yellow), if you had entered at the point of the crossover, your stop loss would be triggered before the stock moved upwards again. This clearly demonstrates that we don't use the stochastic indicator on its own. It must only be used in conjunction with support and resistance lines.
In the example above, the stock had already penetrated the $30 support level. You could've entered the trade once the price action reversed, but ONLY after this validation occurs.
The first bullish up-day, or bearish down-day after bouncing off support or resistance, confirmed by the CStat oscillator is a more reliable entry time.
Using Stochastic Indicator Divergences to Enter Trades
One of the most reliable Stochastic signals is to wait for a bullish or bearish divergence pattern to develop around overbought or oversold levels.
For a rising stock, wait for the oscillator to form a second peak that is lower than the first, with the first above the 80 level and the second below it. This is a strong indication that the security price is about to reverse. Use this principle in reverse for bullish divergences around the 20 level.
An important point worth noting is, that the divergence trend lines should be drawn on the FAST line, not the slow one.
Here are some examples of CStat divergence:


Stochastic Indicator Summary
1. The CStats should never be used without your trendlines and price reversal validation indicating a trade. They provide confirmation only.
2. Use a setting of 5,5, Smooth, Static Zone 80, 20
3. Crossovers are more relevant if they occur in the overbought or oversold zones.
4. Cross overs are more relevant in a sideways trending channel. In strongly trending moves the signals become less relevant.
5. We can also use the Stochastic indicator to find possible hints of divergence and therefore, upcoming trend reversals.
6. In a strong up or down trending market, the CStat can stay level or in the overbought or oversold zones for some time.

**************** ****************
Return to Stock Chart Analysis Contents Page
Go to Option Trading Homepage

Popular Articles
-
Near Riskless Trading Strategies
Near Riskless Trading strategies using options, allows you to use advanced arbitrage techniques for highly profitable, almost risk free results. -
Wealth Building Options Trading
 Wealth building options trading - how to profit from share investments even if you buy at the top of the market.
 -
The Three Legged Box Spread - A Great Lifestyle Trade
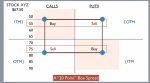 Whether you only have a few thousand or a large sum to invest, the Three Legged Box Spread is one of the best option trading strategies available for retail investors today.
 -
XTR ProTrader Signals
-
The Double Calendar Spread
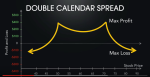 The double calendar spread is a very safe option strategy which profits consistently - provided you know exactly what to do when price action threatens it.
 -
ETF Options - Why You Should Trade Them
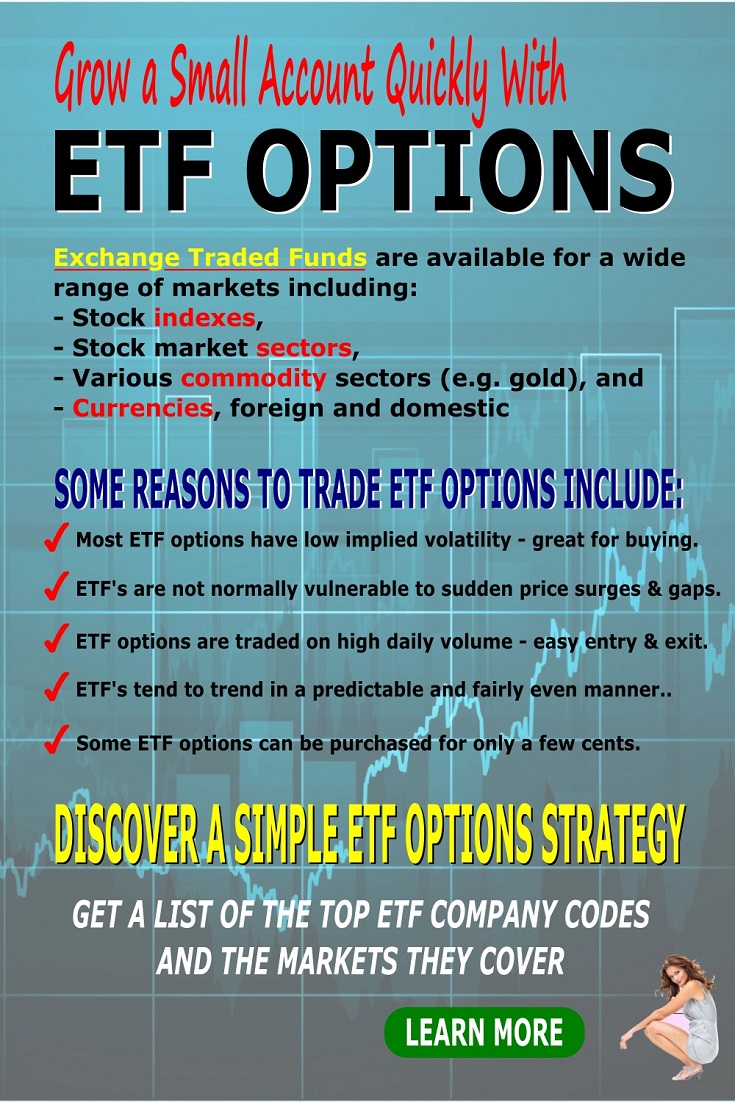 ETF Options when combined with the right options strategy, can be one of the best and safest ways to profit consistently from the financial markets.
 -
The Covered Put Option Strategy
 The covered put option strategy explained, with payoff diagram and examples. These are most suited to a bearish to neutral market.
 -
How to Use the VIX
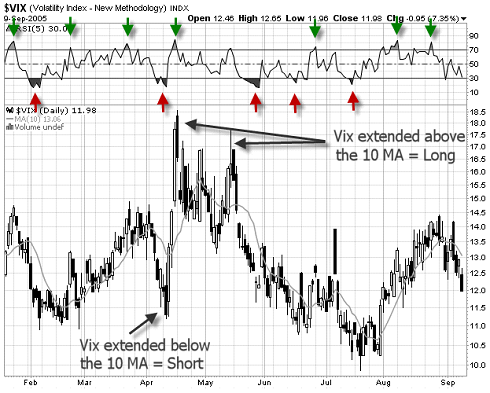 Knowing how to use the VIX should be essential for all traders whose portfolio of positions may be affected by general market sentiment.
 -
Using Options to Buy Stocks at Discount Prices
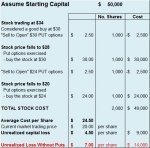 Did you know that you could be using options to buy stocks so much cheaper than if you just went to your broker and simply bought them at market price?
 -
How Option Price Movements Effect Gains and Losses
Knowing about and understanding how options work is a potent arrow in a trader’s quiver. One of the things that people new to options must understand -
When can you trade Forex Options?
The forex market is the largest financial market in the world which works 24 hours, 5 days per week, if you consider the whole world as a single entity. -
Iron Condor Option Strategy
 In this iron condor option strategy we show you the best way to leg into positions safely and also to adjust your positions when they are threatened.
 -
What is a Straddle Option? A Great Delta Neutral Strategy!
 So what is a straddle option and why is it such a great options trading strategy? You don't have to pick market direction and can still profit very well.
 -
The Long Iron Butterfly - Credit Spreads on Steroids
 The long iron butterfly is a range trading strategy and a variation of the Iron Condor. Both these strategies use two credit spreads using both calls and puts
 -
The Distinct Advantage Credit Spreads Are Known For
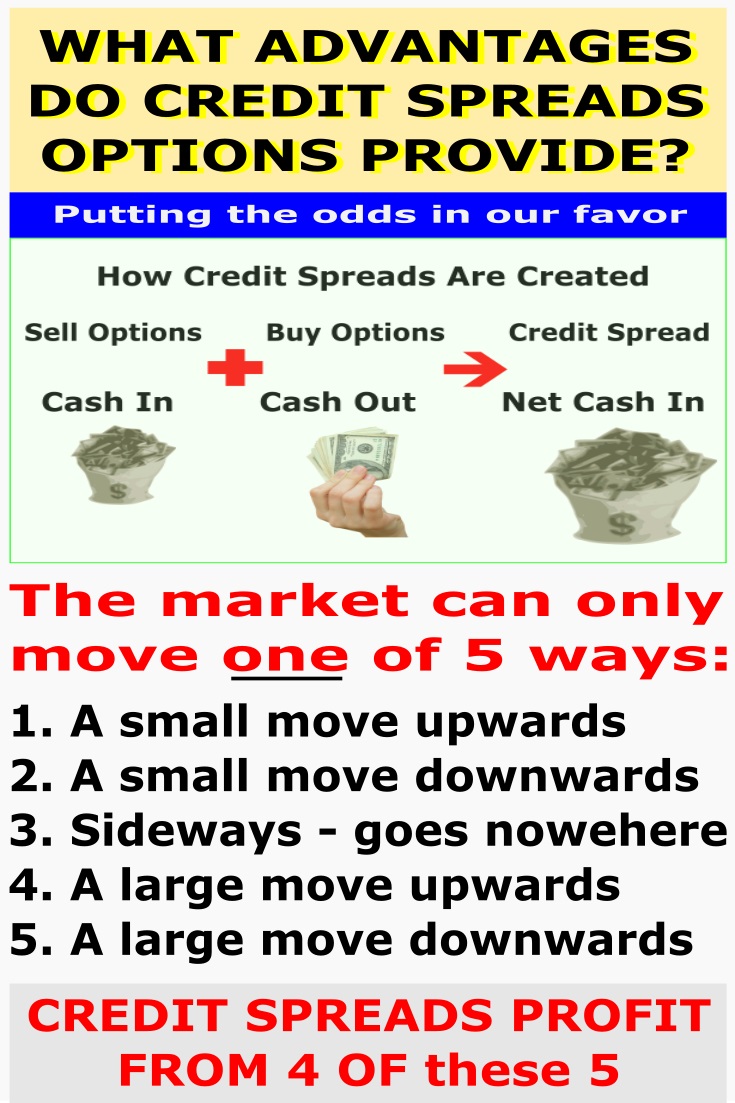 So what is the advantage credit spreads give us? This example will demonstrate how we can turn a losing trade into a profitable one.
 -
Box spreads Illustrated and Explained
Box spreads are an option trading strategy that involves purchasing a bull-call spread with a corresponding bear-put spread. The two vertical spreads have the same expiration dates and strike prices. -
Exotic Options Explained With Examples
Exotic options are typically more complex than regular options. They are most popularly traded on currency pairs but can also be traded on stock options, stock indexes, warrants and commodity options -
Hoadley Options Tools Review
 Hoadley Options Trading and Investment Tools is an Excel based tool that makes options risk analysis easy.
 -
Free Option Trading Software
So we've done some research for you and below, you'll find a summary of some of the best free option trading software available. -
Invest in Soxange and Multiply Earnings through Copying the Top Traders in this Social Network
Within the context of the online trading world, SoXange is one of the few trading platforms that draw all kinds of traders in droves to that online trading

Amazon Affiliate
Copyright © 2002- Options Trading Mastery. ALL RIGHTS RESERVED.
Other Recommended sites:
NaturalRelieved | European Travel Escape | Relationships Guide
New! Comments
Have your say about what you just read! Leave me a comment in the box below.