Search Options Trading Mastery:
- Home
- Stock Chart Analysis
- Fibonacci Percentages
How to Use Fibonacci Percentages for Profitable Trading
Fibonacci Percentages are primarily based upon the sequence of Fibonacci retracement and extension numbers, one of which (0.618) is known as "the golden ratio" because it occurs many times in nature. Historically speaking, the Fibonacci sequence actually appeared first as a solution in the Liber Abaci’s problem.
In 1202, a book was then written by Leonardo Fibonacci to introduce the Hindu-Arabic numerals that are used widely today, into a medieval Europe that was still using the Roman numerals.
The Fibonacci numbers have been used in forex trading, especially in connection with technical analysis. They are also very popular in connection with stock and options trading circles because they identify likely pullback targets in trending markets before the stocks resume their current direction.
Essential Retracement Levels With Fibonacci Percentages
Fibonacci retracements can essentially identify potential resistance or support levels. The most common Fibonacci levels that are being used are 38.2%, 50%, and 61.8% with some other percentages that serve as secondary levels. There are also three profit tips for those who are using the numbers of Fibonacci which include the following:
1. Fibonacci Numbers define stop loss levels
A trader can always utilize the Fibonacci numbers to set stop loss orders. Fibonacci numbers are useful for defining stops if the trader has traded off a support level and this support level is now being violated. When the price action breaches a perceived support level, the 50.0% or 61.8% areas from the original price peak can be chosen to exit the trade.
2. Fibonacci Percentages Defines the Portion Size
The Fibonacci numbers can likewise define the position size which depends upon the level of risk that you are prepared to take for your trades. For example, let's say that you see a pullback within a trend, to 61.8% and then continuation is confirmed at 50% of the impulsive move.
Now if your profit target is the 127.2% extension level and your stop is set at a 76.4% retracement, you'll have more than 2:1 profit to loss ratio. Based on this risk-to-reward scenario, you can determine how much you will risk on the trade.
3. Fibonacci Numbers Define Profit Targets
With using Fibonacci numbers, you can start using them for setting profit objectives, for example, taking partial profits once the target has been reached according to the anticipated Fibonacci level.
The great advantage of the Fibonacci numbers, particularly the golden ratio, is that they essentially remove emotion from the trading process by pre-defining stop losses and setting your profit objectives.
3 Primary Fibonacci Percentages
Moreover, when used in technical analysis, there are 3 main Fibonacci retracement levels - 38.2%, 50%, and 61.8%. However, there are also some other important extension levels, including 100%, 127.2% 150% 161.8% 200% and so on.
There are also 4 main techniques for the implementation of the Fibonacci sequence to currency trading which include:
- Time zones
- Arcs
- Fans
- Retracements
Fibonacci analysis has always been an important tool for modern investors. Most traders are still cautious about using this form of analysis in all market conditions, however, the accuracy and reliability of Fibonacci analysis has made it one of the most well known and popular signals, particularly to forex traders and by extension, forex options traders.
While it is true that there are still many traders who question the scientific basis for it, Fibonacci percentages in their role as as retracement levels are still as reliable and dependable as any other tool available to traders today. From personal experience, I believe that savvy traders can gain an edge by using the Fibonacci analysis and techniques.
When used in conjunction with Elliott Wave Theory, Fibonacci retracements and extensions can be a powerful combination.
Want to know how to use Fibonacci retracement percentages to get the best risk-to-reward ratio from swing trading?

**************** ****************
Return to Stock Chart Analysis Contents Page
Go to Option Trading Homepage

Popular Articles
-
Near Riskless Trading Strategies
Near Riskless Trading strategies using options, allows you to use advanced arbitrage techniques for highly profitable, almost risk free results. -
Wealth Building Options Trading
 Wealth building options trading - how to profit from share investments even if you buy at the top of the market.
 -
The Three Legged Box Spread - A Great Lifestyle Trade
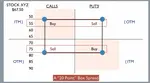 Whether you only have a few thousand or a large sum to invest, the Three Legged Box Spread is one of the best option trading strategies available for retail investors today.
 -
XTR ProTrader Signals
-
The Double Calendar Spread
 The double calendar spread is a very safe option strategy which profits consistently - provided you know exactly what to do when price action threatens it.
 -
ETF Options - Why You Should Trade Them
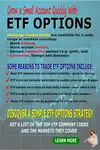 ETF Options when combined with the right options strategy, can be one of the best and safest ways to profit consistently from the financial markets.
 -
The Covered Put Option Strategy
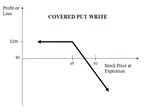 The covered put option strategy explained, with payoff diagram and examples. These are most suited to a bearish to neutral market.
 -
How to Use the VIX
 Knowing how to use the VIX should be essential for all traders whose portfolio of positions may be affected by general market sentiment.
 -
Using Options to Buy Stocks at Discount Prices
 Did you know that you could be using options to buy stocks so much cheaper than if you just went to your broker and simply bought them at market price?
 -
How Option Price Movements Effect Gains and Losses
Knowing about and understanding how options work is a potent arrow in a trader’s quiver. One of the things that people new to options must understand -
When can you trade Forex Options?
The forex market is the largest financial market in the world which works 24 hours, 5 days per week, if you consider the whole world as a single entity. -
Iron Condor Option Strategy
 In this iron condor option strategy we show you the best way to leg into positions safely and also to adjust your positions when they are threatened.
 -
What is a Straddle Option? A Great Delta Neutral Strategy!
 So what is a straddle option and why is it such a great options trading strategy? You don't have to pick market direction and can still profit very well.
 -
The Long Iron Butterfly - Credit Spreads on Steroids
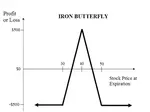 The long iron butterfly is a range trading strategy and a variation of the Iron Condor. Both these strategies use two credit spreads using both calls and puts
 -
The Distinct Advantage Credit Spreads Are Known For
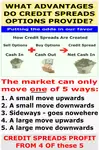 So what is the advantage credit spreads give us? This example will demonstrate how we can turn a losing trade into a profitable one.
 -
Box spreads Illustrated and Explained
Box spreads are an option trading strategy that involves purchasing a bull-call spread with a corresponding bear-put spread. The two vertical spreads have the same expiration dates and strike prices. -
Exotic Options Explained With Examples
Exotic options are typically more complex than regular options. They are most popularly traded on currency pairs but can also be traded on stock options, stock indexes, warrants and commodity options -
Hoadley Options Tools Review
 Hoadley Options Trading and Investment Tools is an Excel based tool that makes options risk analysis easy.
 -
Free Option Trading Software
So we've done some research for you and below, you'll find a summary of some of the best free option trading software available. -
Invest in Soxange and Multiply Earnings through Copying the Top Traders in this Social Network
Within the context of the online trading world, SoXange is one of the few trading platforms that draw all kinds of traders in droves to that online trading

Amazon Affiliate
Copyright © 2002- Options Trading Mastery. ALL RIGHTS RESERVED.
Other Recommended sites:
NaturalRelieved | European Travel Escape | Relationships Guide
New! Comments
Have your say about what you just read! Leave me a comment in the box below.