Search Options Trading Mastery:
- Home
- Stock Chart Analysis
- Candlestick Patterns
Candlestick Patterns and What They Mean
The most effective way of understanding candlestick patterns and what they mean, is to first divide them into their three main categories:
- Bearish reversal patterns
- Continuation patterns
- Bullish reversal patterns
In addition, it's important to remember that once we understand the candlestick patterns basics, we don't want to confine ourselves to using them as a standalone method for stock chart analysis.
The most successful price action prediction outcomes combine candlestick patterns and what they mean with some other key elements that affect price, such as support and resistance levels, particularly on higher time frames, and trend lines.
Putting these together, we can be confident that we have a candlestick patterns strategy that will serve us well and produce many profitable trading opportunities.
Candlestick chart patterns work best on daily charts because the price action during this period contains a lot more data to work with. This doesn't mean that they can't also work on shorter time frames and you'll find a number of articles or videos to that effect.
However, the examples and comments that you're about to read are all based on daily candlestick charts. At the end of the day, the candlesticks tell a story.
Over time, individual candlesticks form patterns that traders can use to recognize major support and resistance areas. There are a great many candlestick patterns that indicate opportunities within any given market.
Some provide insight into the balance between buying and selling pressure, while others identify continuation patterns or market indecision.
So let's get started . . .
Six Bullish Candlestick Patterns and What They Mean
Bullish patterns form at the end of a market downtrend and signal to the trader, that price movement is about to reverse direction. When you see these signals, you should be thinking about strategies that will profit from an upward trajectory in the market.
1. The Hammer
The Hammer candlestick pattern comprises a short body with a long, lower wick and is showing us that although there was selling pressure during the day, this was then cancelled out by strong buying pressure that drove the price back up.
A green hammer, where price closes higher than the open, is a stronger signal than a red hammer, where prices closes lower than the open.

2. Inverse Hammer
The Inverted Hammer is a similarly bullish candlestick pattern to the above mentioned Hammer, the only difference being, that the upper wick is long while the lower wick of the candle, is short. It indicates buying pressure, followed by a selloff that wasn't strong enough to drive the market price down. It tells the trader that buyers may soon have control of the market.

3. Bullish Engulfing Pattern
This is a combination of two candlesticks. The first candle has a short red body that is completely engulfed by a larger green candle. Even though the second day opens lower than the first one, buyers push the price up, culminating in the buyers being victorious. Traders should expect this momentum to continue.

4. Piercing Line
The Piercing Line, like the Bullish Engulfing, is a two candlestick pattern. The first candle is a long red (bearish) one. The next candle is a long green (bullish) candle. It also usually includes a gap down between the closing price of the first candle and the opening price of the next.
The reason why it is called a "piercing line" is because that "line" in question is the mid-price of the first candle. To qualify as a Piercing Line pattern, the second bullish candle must push price up to above a level that is 50 percent of the first candle.

5. Morning Star
As the end of a market downtrend approaches, the Morning Star candlestick pattern is considered a sign of hope. This one is a three candlestick pattern. It includes a long bearish candle and a long bullish candle on either side of one short-bodied candle.
For it to be a "Morning Star" the body of the small candle should not overlap the bodies of the two larger candles on either side.
The best Morning Star patterns occur when the body of the third candle is higher than that of the first candle but this is not essential to the definition. Sometimes, a short pause follows and then price continues upward.

6. Three White Soldiers
This pattern occurs over three days and consists of bullish green candles with small wicks, each of which closes higher than the previous day. This is a very strong bullish signal that signals the reversal of a downward trend.

Six Bearish Candlestick Patterns and What They Mean
These bearish candlestick patterns form at the end of an uptrend and signify a reversal to lower price action. They are most effective when confirmed by resistance areas, such as major resistance levels on higher time frames, the top of channel patterns, or protruding out of and then withdrawing back into the top of wide volatility Bollinger Bands.
1. Hanging Man
The Hanging Man is the bearish equivalent to the bullish Hammer. Looking at the image below, you can see why it's called that. It indicates that there was a significant sell-off during the day, but that buyers were able to push the price back up again.
However, the large sell-off is an indication that the upward momentum is declining and we're in a period of indecision. A bearish candle that follows will confirm our belief that either a reversal or short term pullback is on the horizon.

2. Shooting Star
The Shooting Star candlestick pattern is the reverse of the Inverse Hammer and forms at the end of an uptrend. It has a small lower body and a large upper wick. It's called a "shooting star" because price will rise during intraday trading but later, will reject the highs and fall back to the ground.

3. Bearish Engulfing Pattern
This candlestick pattern occurs at the end of an uptrend. You'll see a small green (bullish) body which is then engulfed by a long red (bearish) candle. This indicates a peak, or slowing down, of upward price trajectory and foreshadows an impending reversal or pullback.
The stronger the second red candle is, the more significant that a continuation downwards is likely to be.
4. Evening Star Pattern
Unlike most other patterns discussed here, the Evening Star is a three star candlestick pattern and is the opposite of the bullish Morning Star. When you observe a small green candle sandwiched between a long green candle and a long red candle, then you know that you're looking at an Evening Star.
It is confirmation of a bearish price reversal or pullback and is especially so when the third, i.e. red, candle closes lower than the open on the first candle.

5. Three Black Crows
This candlestick pattern comprises three consecutive bearish red candles that have either very small or non-existant wicks. The close of the previous day is virtually the same as the open of the next day, but each day, the price descends lower and lower. Traders interpret this as the beginning of a new downtrend.

6. Dark Cloud Cover
This pattern tells you that a bearish reversal is underway. The bullish green candle optimism of the previous day is overshadowed by a red bearish candle that almost engulfs it, but not quite. It closes below its mid-point. If the wicks of the second candle are short then you know that the bearish reaction to upward price has been decisive.

Four Candlestick Continuation Patterns
Whilst the patterns that we have been looking at so far, are reversal patterns, the following indicate a short period of rest in the market before price continues in its original direction.
1. The Doji
When price action in one day (or other period) has a very narrow range and almost closes where it opens, so that the candle resembles a small cross, you're looking at a Doji.
These candles typically have a short, to non-existent, body, but the wick size may vary. It indicates a struggle between buyers and sellers which results in indecision as to which way price action should proceed.
You will observe the Doji as part of the Morning and Evening Star candlestick patterns, but when they appear alone, they're a neutral signal and more likely showing us a pause before price continues.
If you see a few Doji-like candles consecutively following each other at an extremity, followed by a price breakout, then you should consider this to be a breakout from price consolidation which, if at or near the touch of a trendline, can be very powerful.

2. Spinning Top
The Spinning Top candlestick pattern has a short body which appears between wicks of equal length. It's telling us that the market is indecisive. The bulls and bears have equal strength.
If you see a few of these Doji-like candles consecutively following each other at an area which your analysis tells you involves a decision point, such as near the touch of a trend line, followed by a price breakout, then you should consider this to be a very powerful signal that price action will continue in the direction of the trend line.

3. Falling Three Methods
This involves three consecutive green bullish candles which move in the opposite direction to the prevailing down trend before price continues downward. On either side of these three candles, you want to see two strong bearish candles with long bodies and insignificant wicks.
You also want to see the three green candles contained within the range of the two bearish candles. It means that the bulls didn't have enough support to realize a price reversal, so expect a downward price trajectory from here.

4. Rising Three Method
This pattern is the opposite of the one directly above. Again, you're looking for three red candles contained with the range of two decisive green candles. They indicate a short pause in the market before price action continues upward.

Now that you have a good grasp of candlestick patterns and what they mean, this would be a good time to practice recognizing them by going back over some stock or forex price charts and highlighting them. Observe where they work best and under what conditions. Then you can formulate your successful trading plan.
Remember, successful trading is not about winning every time. It is about placing the odds as much in your favor as possible. After that, it's just a numbers game.
**************** ****************
Return to Stock Chart Analysis Main Page
Go to Option Trading Homepage

Add a Comment
We and other readers of this information site value your input.
You can also (optionally) include any graphics such as charts, if you wish.
Popular Articles
-
Near Riskless Trading Strategies
Near Riskless Trading strategies using options, allows you to use advanced arbitrage techniques for highly profitable, almost risk free results. -
Wealth Building Options Trading
 Wealth building options trading - how to profit from share investments even if you buy at the top of the market.
 -
The Three Legged Box Spread - A Great Lifestyle Trade
 Whether you only have a few thousand or a large sum to invest, the Three Legged Box Spread is one of the best option trading strategies available today.
 -
XTR ProTrader Signals
-
The Double Calendar Spread
 The double calendar spread is a very safe option strategy which profits consistently - provided you know exactly what to do when price action threatens it.
 -
ETF Options - Why You Should Trade Them
 ETF Options when combined with the right options strategy, can be one of the best and safest ways to profit consistently from the financial markets.
 -
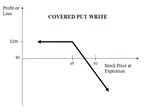
The Covered Put Option Strategy
 The covered put option strategy explained, with payoff diagram and examples. These are most suited to a bearish to neutral market.
 -
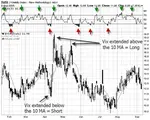
How to Use the VIX
 Knowing how to use the VIX should be essential for all traders whose portfolio of positions may be affected by general market sentiment.
 -
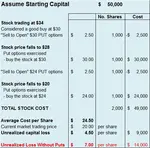
Using Options to Buy Stocks at Discount Prices
 Did you know that you could be using options to buy stocks so much cheaper than if you just went to your broker and simply bought them at market price?
 -
How Option Price Movements Effect Gains and Losses
Knowing about and understanding how options work is a potent arrow in a trader’s quiver. One of the things that people new to options must understand -
When can you trade Forex Options?
The forex market is the largest financial market in the world which works 24 hours, 5 days per week, if you consider the whole world as a single entity. -
Iron Condor Option Strategy
 In this iron condor option strategy we show you the best way to leg into positions safely and also to adjust your positions when they are threatened.
 -
What is a Straddle Option? A Great Delta Neutral Strategy!
 So what is a straddle option and why is it such a great options trading strategy? You don't have to pick market direction and can still profit very well.
 -
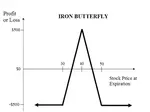
The Long Iron Butterfly - Credit Spreads on Steroids
The long iron butterfly is a range trading strategy and a variation of the Iron Condor. Both these strategies use two credit spreads using both calls and puts -
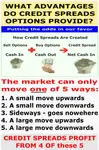
The Distinct Advantage Credit Spreads Are Known For
So what is the advantage credit spreads give us? This example will demonstrate how we can turn a losing trade into a profitable one. -
Box spreads Illustrated and Explained
Box spreads are an option trading strategy that involves purchasing a bull-call spread with a corresponding bear-put spread. The two vertical spreads have the same expiration dates and strike prices. -
Exotic Options Explained With Examples
Exotic options are typically more complex than regular options. They are most popularly traded on currency pairs but can also be traded on stock options, stock indexes, warrants and commodity options -
Hoadley Options Tools Review
 Hoadley Options Trading and Investment Tools is an Excel based tool that makes options risk analysis easy.
 -
Free Option Trading Software
So we've done some research for you and below, you'll find a summary of some of the best free option trading software available. -
Invest in Soxange and Multiply Earnings through Copying the Top Traders in this Social Network
Within the context of the online trading world, SoXange is one of the few trading platforms that draw all kinds of traders in droves to that online trading


Amazon Affiliate
Copyright © 2002- Options Trading Mastery. ALL RIGHTS RESERVED.
Other Recommended sites:
NaturalRelieved | European Travel Escape | Relationships Guide
New! Comments
Have your say about what you just read! Leave me a comment in the box below.