Search Options Trading Mastery:
- Home
- Stock Chart Analysis
- Dragonfly Doji Candlestick Pattern
Dragonfly Doji Candlestick Pattern: Meaning, Identification and Trading Strategies
The Dragonfly Doji Candlestick Pattern is one of the most distinctive candlestick formations used in technical analysis.
Recognizable by its unusual “T” shape, the Dragonfly Doji can provide traders with valuable information about market sentiment, buying pressure, selling pressure, and the possibility of a trend reversal.
Although a single candlestick should never be treated as a guaranteed trading signal, the Dragonfly Doji becomes particularly interesting when it develops after an extended decline or around an important support level.
In these circumstances, it may indicate that sellers attempted to push the market substantially lower but were ultimately overwhelmed by buyers.
Understanding the Dragonfly Doji Candlestick Pattern can therefore help traders recognize potential turning points and improve their interpretation of price action.
What Is a Dragonfly Doji Candlestick Pattern?
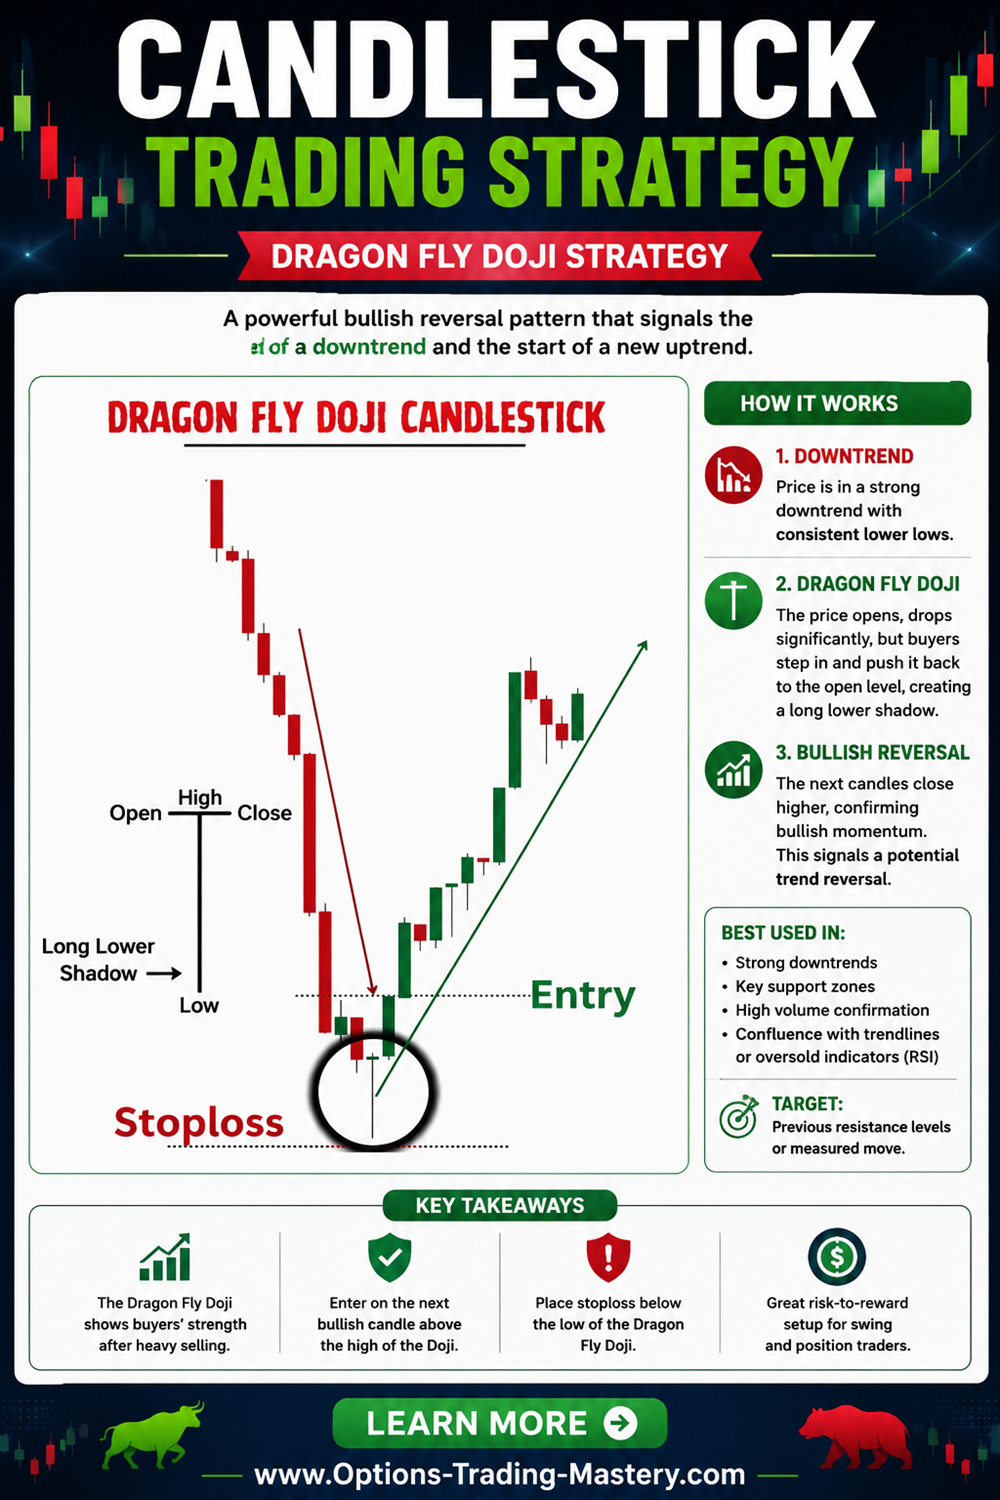
A Dragonfly Doji Candlestick Pattern is a single-candle formation characterized by an opening price, closing price, and high price that occur at approximately the same level. The candle has a long lower shadow and little or no upper shadow.
This produces the characteristic appearance of a capital letter “T.”
In a textbook Dragonfly Doji:
- The open and close are virtually identical.
- The open and close occur close to the high of the period.
- There is little or no upper wick.
- There is a long lower wick or shadow.
- The candle has almost no real body.
This structure distinguishes the Dragonfly Doji from many other candlestick patterns. StockCharts describes the classic formation as occurring when the open, high and close are equal while the low creates a long lower shadow.
In real financial markets, however, candlesticks rarely form perfectly. The opening and closing prices can therefore be slightly different while the candle still resembles a Dragonfly Doji.
What Does the Dragonfly Doji Mean?
To understand the Dragonfly Doji Candlestick Pattern, it is useful to examine what happens between buyers and sellers while the candle is forming.
Imagine that a stock opens at $50.
Shortly after the market opens, selling pressure increases and the price falls significantly, perhaps reaching $46.
At this stage, sellers appear to be firmly in control.
However, buyers begin entering the market around the lower price. Demand becomes strong enough to absorb the selling pressure and push the stock upward.
By the end of the session, the price has recovered almost completely and closes near $50—the same area where it opened.
The resulting candle has virtually no body but a long lower wick.
This tells an important price-action story:
Sellers successfully pushed the market lower, but they could not keep it there.
Buyers eventually regained the lost ground and forced the price back toward the session high.
That rejection of lower prices is the principal reason traders associate the Dragonfly Doji with potential bullish reversals, particularly following a downtrend.
Dragonfly Doji After a Downtrend
The location of a candlestick pattern can be just as important as the pattern itself.
A Dragonfly Doji Candlestick Pattern after a downtrend is generally the situation that attracts the greatest attention from traders.
Suppose a stock has been declining for several weeks. Sellers have controlled the trend, and each rally has been followed by additional selling.
Eventually, a Dragonfly Doji develops.
During that session, sellers initially continue pushing the stock downward. Instead of remaining near its low, however, the stock experiences strong buying pressure and recovers almost the entire decline before the session closes.
This could indicate that bearish momentum is weakening.
The Dragonfly Doji therefore becomes evidence of price rejection.
However, it does not automatically mean that a new uptrend has begun. Confirmation from subsequent price action remains important.
How to Confirm a Dragonfly Doji
One of the most common mistakes in candlestick trading is entering a position simply because a particular candle has appeared.
The Dragonfly Doji Candlestick Pattern should normally be considered in conjunction with confirmation.
One possible form of bullish confirmation occurs when the next candle moves above the high of the Dragonfly Doji and demonstrates continued buying pressure. Technical-analysis references similarly emphasize that the reversal implications depend on preceding price action and subsequent confirmation.
Traders may also look for supporting evidence from:
- Previous support levels
- Trendlines
- Moving averages
- Trading volume
- Relative Strength Index (RSI)
- Fibonacci retracement levels
- Previous swing lows
- Momentum indicators
- Other bullish candlestick patterns
The more independent evidence pointing toward the same conclusion, the more meaningful the setup may become.
This concept is often called technical confluence.
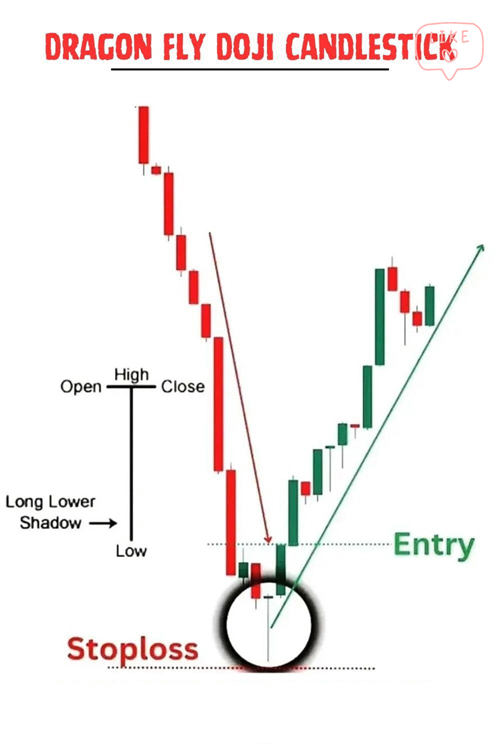
Dragonfly Doji at Support
A Dragonfly Doji appearing randomly in the middle of a trading range may have relatively little significance.
The same candlestick appearing at a major support level can be considerably more interesting.
Suppose a stock has previously found buyers around $100 on several occasions.
The stock declines toward $100 again and briefly trades below that level. During the same session, however, buyers enter aggressively and push the stock back above $100.
If the candle closes near its opening price and produces a long lower shadow, a Dragonfly Doji may appear.
The pattern now provides two pieces of technical information:
The market has reached an established support area.
The Dragonfly Doji demonstrates rejection of prices below that area.
This combination may provide stronger evidence of a possible reversal than the candlestick alone.
Dragonfly Doji vs. Hammer Candlestick
The Dragonfly Doji and Hammer candlestick can look extremely similar.
Both typically have:
- A long lower shadow
- Little or no upper shadow
- A position near the top of the candle's range
- Potential bullish implications after a decline
The primary difference is the real body.
A Dragonfly Doji has an extremely small or virtually nonexistent body because the opening and closing prices are almost identical.
A Hammer candlestick has a visible real body because the opening and closing prices are separated.
Consequently, traders should examine the relationship between the open and close carefully rather than identifying a pattern solely from its general shape.
Dragonfly Doji vs. Gravestone Doji
Another important comparison is the Dragonfly Doji vs. Gravestone Doji.
Visually, the patterns are essentially opposites.
The Dragonfly Doji has a long lower shadow, while the Gravestone Doji has a long upper shadow.
A Dragonfly Doji shows that sellers drove prices lower before buyers pushed them back upward.
A Gravestone Doji tells the opposite story: buyers pushed prices substantially higher, but sellers eventually forced prices back toward the opening level.
For this reason, a Gravestone Doji appearing after an uptrend is commonly watched as a potential bearish reversal signal, whereas a Dragonfly Doji after a downtrend is commonly watched for a potential bullish reversal.
How Traders May Trade the Dragonfly Doji Pattern
There are several ways traders may incorporate the Dragonfly Doji Candlestick Pattern into a broader trading strategy.
A conservative approach is to wait for confirmation rather than buying immediately when the Dragonfly Doji appears.
For example, a trader might first identify a downtrend approaching an important support level. A Dragonfly Doji then forms around that support.
Instead of immediately entering the market, the trader waits to see whether the following candle demonstrates additional buying pressure.
A potential sequence might therefore be:
Downtrend → Support → Dragonfly Doji → Bullish Confirmation → Possible Entry
Some traders use a break above the Dragonfly Doji's high as part of their entry criteria. The low of the Dragonfly candle may also provide a technically meaningful reference point for risk management because a decisive move below that low could suggest that the rejection represented by the pattern has failed.
The precise entry, stop-loss and position size should depend on the trader's strategy, risk tolerance and the volatility of the asset.
Using Volume With a Dragonfly Doji
Volume can provide additional information when analyzing candlestick patterns.
Consider two Dragonfly Dojis.
The first occurs during extremely quiet trading with very little volume.
The second develops at major support following a sharp decline and is accompanied by unusually heavy trading volume.
The second formation may deserve greater attention because substantial market participation occurred while lower prices were being rejected.
High volume does not guarantee a reversal, but it may strengthen the interpretation that a meaningful battle occurred between buyers and sellers.
Dragonfly Doji and RSI
The Relative Strength Index (RSI) can also be used alongside a Dragonfly Doji.
For example, imagine that a stock has experienced a significant decline and its RSI has moved into an oversold area.
The stock then reaches historical support and forms a Dragonfly Doji.
A trader now has several pieces of evidence:
The existing downtrend has become extended.
RSI indicates potentially oversold conditions.
Price has reached support.
The Dragonfly Doji shows strong rejection of lower prices.
If bullish confirmation subsequently appears, the overall setup may be more compelling than a Dragonfly Doji appearing without any supporting technical factors.
Dragonfly Doji in an Uptrend
Although the Dragonfly Doji Candlestick Pattern is most commonly associated with potential bullish reversals following declines, it can also occur after an advance.
The interpretation changes with context.
After a strong uptrend, a Dragonfly Doji indicates considerable intraperiod selling pressure even though buyers ultimately recovered the losses before the close.
This may represent uncertainty rather than an immediate bullish opportunity.
Some technical-analysis references therefore treat the Dragonfly Doji as a potential reversal pattern in either direction depending on the preceding trend and subsequent confirmation.
This reinforces an essential principle of candlestick analysis:
Context matters more than the name of the candle.
Advantages of the Dragonfly Doji Candlestick Pattern
One advantage of the Dragonfly Doji is that it is visually distinctive and relatively easy to identify.
Its long lower wick provides immediate information about rejection of lower prices.
The pattern can also be applied across numerous markets, including:
- Stocks
- Exchange-traded funds
- Stock indexes
- Forex
- Futures
- Commodities
- Cryptocurrencies
It can also appear across different chart intervals, from intraday charts to daily and weekly charts.
Another advantage is that the candle provides clearly identifiable price levels. Its high can potentially be used for confirmation, while its low provides an obvious level for determining whether the original rejection has failed.
Limitations of the Dragonfly Doji
Despite its usefulness, the Dragonfly Doji Candlestick Pattern has important limitations.
Most importantly, it does not guarantee a reversal.
A Dragonfly Doji can form and be followed immediately by additional selling.
The candle may also produce false signals during sideways markets, highly volatile conditions or periods of low liquidity.
Another limitation involves risk-to-reward considerations. Because a Dragonfly Doji can have an unusually long lower wick, using the low of the candle as a stop-loss reference could result in a relatively wide stop.
Traders should therefore evaluate the complete market environment rather than automatically trading every Dragonfly Doji they encounter.
Common Mistakes When Trading Dragonfly Doji Patterns
Several mistakes can reduce the effectiveness of candlestick analysis.
One is ignoring the preceding trend. A Dragonfly Doji following a substantial decline has a very different context from one appearing randomly during sideways trading.
Another is entering without confirmation.
A third is ignoring support and resistance. Candlestick patterns often become more useful when they occur around technically significant price levels.
Finally, traders should avoid risking excessive capital because a pattern appears convincing. No candlestick pattern eliminates uncertainty.
Risk management remains essential.
Is the Dragonfly Doji Bullish?
The Dragonfly Doji is generally considered to have its strongest bullish implications when it appears following a downtrend or at an important support level.
Its long lower shadow demonstrates that sellers were capable of driving the price considerably lower but were unable to maintain control.
Buyers recovered the decline and brought the price back toward its opening level.
That is potentially bullish information—but it is evidence of a possible shift rather than proof that a reversal will occur.
The next candle and the surrounding chart structure can therefore be crucial.
Final Thoughts on the Dragonfly Doji Candlestick Pattern
The Dragonfly Doji Candlestick Pattern provides traders with a simple visual representation of an important shift in market psychology.
Its distinctive T-shaped structure develops when sellers push the market significantly lower, only for buyers to regain control and return the price close to where the period began.
When the pattern appears after an established downtrend, particularly around support, it can warn that bearish momentum is weakening and that a bullish reversal may be developing.
However, the most effective way to use the Dragonfly Doji is not as an isolated buy signal.
Instead, traders can combine it with support and resistance, volume, market structure, trend analysis, moving averages, RSI and subsequent candlestick confirmation.
Ultimately, the Dragonfly Doji is best understood as evidence of rejection of lower prices. It identifies an area where sellers attempted to take control but failed to hold the market down.
For traders learning technical analysis and candlestick chart patterns, understanding the Dragonfly Doji Candlestick Pattern can provide another useful tool for recognizing potential changes in market momentum and making more informed trading decisions.
Educational content only. Candlestick patterns and technical indicators cannot predict future market movements with certainty, and trading involves risk.

Your second block of text...
Add a Comment
We and other readers of this information site value your input.
You can also (optionally) include any graphics such as charts, if you wish.
Popular Articles


-
Dragonfly Doji Candlestick Pattern: Meaning and Trading Strategies
 The Dragonfly Doji Candlestick Pattern is one of the most distinctive candlestick formations used in technical analysis.
 -
Near Riskless Trading Strategies
Near Riskless Trading strategies using options, allows you to use advanced arbitrage techniques for highly profitable, almost risk free results. -
Wealth Building Options Trading
 Wealth building options trading - how to profit from share investments even if you buy at the top of the market.
 -
The Three Legged Box Spread - A Great Lifestyle Trade
 Whether you only have a few thousand or a large sum to invest, the Three Legged Box Spread is one of the best option trading strategies available today.
 -
XTR ProTrader Signals
-
The Double Calendar Spread
 The double calendar spread is a very safe option strategy which profits consistently - provided you know exactly what to do when price action threatens it.
 -
ETF Options - Why You Should Trade Them
 ETF Options when combined with the right options strategy, can be one of the best and safest ways to profit consistently from the financial markets.
 -
The Covered Put Option Strategy
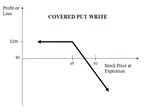
 The covered put option strategy explained, with payoff diagram and examples. These are most suited to a bearish to neutral market.
 -
How to Use the VIX
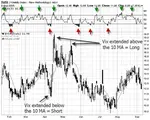
 Knowing how to use the VIX should be essential for all traders whose portfolio of positions may be affected by general market sentiment.
 -
Using Options to Buy Stocks at Discount Prices
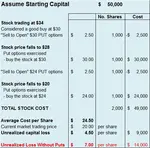
 Did you know that you could be using options to buy stocks so much cheaper than if you just went to your broker and simply bought them at market price?
 -
How Option Price Movements Effect Gains and Losses
Knowing about and understanding how options work is a potent arrow in a trader’s quiver. One of the things that people new to options must understand -
When can you trade Forex Options?
The forex market is the largest financial market in the world which works 24 hours, 5 days per week, if you consider the whole world as a single entity. -
Iron Condor Option Strategy
 In this iron condor option strategy we show you the best way to leg into positions safely and also to adjust your positions when they are threatened.
 -
What is a Straddle Option? A Great Delta Neutral Strategy!
 So what is a straddle option and why is it such a great options trading strategy? You don't have to pick market direction and can still profit very well.
 -
The Long Iron Butterfly - Credit Spreads on Steroids
The long iron butterfly is a range trading strategy and a variation of the Iron Condor. Both these strategies use two credit spreads using both calls and puts -
The Distinct Advantage Credit Spreads Are Known For
So what is the advantage credit spreads give us? This example will demonstrate how we can turn a losing trade into a profitable one. -
Box spreads Illustrated and Explained
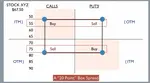
Box spreads are an option trading strategy that involves purchasing a bull-call spread with a corresponding bear-put spread. The two vertical spreads have the same expiration dates and strike prices. -
Exotic Options Explained With Examples
Exotic options are typically more complex than regular options. They are most popularly traded on currency pairs but can also be traded on stock options, stock indexes, warrants and commodity options -
Hoadley Options Tools Review
 Hoadley Options Trading and Investment Tools is an Excel based tool that makes options risk analysis easy.
 -
Free Option Trading Software
So we've done some research for you and below, you'll find a summary of some of the best free option trading software available.







Amazon Affiliate
Copyright © 2002- Options Trading Mastery. ALL RIGHTS RESERVED.
Other Recommended sites:
NaturalRelieved | European Travel Escape | Relationships Guide
